What is data analysis? Tools, processes, and analysis techniques
What is data analysis? Data analysis is not just a trend; it is a powerful method that helps businesses optimize processes and gain a competitive edge. This article by 1Office will introduce modern data analysis tools and how to apply different analysis methods to daily business operations.
Learn how CEOs and Managers can use these methods to make accurate decisions, improve performance, and drive sustainable growth for their businesses!
Mục lục
1. What is data analysis?

Data analysis is the process of collecting, processing, and examining data to extract valuable information and support business decision-making. The goal of data analysis is to transform raw data into actionable insights that can be used to optimize processes, identify new trends, and solve business problems.
This is a crucial step in understanding the current state of a business, helping managers and leaders develop more accurate growth strategies. Data analysis can be performed using qualitative or quantitative methods, with the help of modern software tools.
Simply put, data analysis is not just about looking at data but also about discovering the stories hidden behind the numbers to make smarter, more effective decisions for the business.
2. The significance of data analysis in business
Data analysis plays a key role in optimizing strategic decisions and helping businesses thrive in a fiercely competitive environment. With the vast amount of data businesses collect from various sources, accurate and effective analysis can help them make smart decisions, save costs, and achieve sustainable growth.
Optimize processes and performance
Data analysis helps identify weaknesses in business processes and find solutions to improve work efficiency. Analyzing data on work performance, inventory status, or production time can help businesses optimize processes and minimize unnecessary costs.
Enhance service quality and customer experience
By analyzing customer behavior and related data, businesses can better understand customer needs and preferences. This helps improve service quality, develop products that meet actual customer demands, enhance the customer experience, and increase customer retention rates.
Predict market trends and demand
Data analysis helps businesses predict future trends based on patterns and behaviors in historical data. Analysis tools help identify potential markets, popular products, and changes in customer tastes, enabling businesses to prepare for the future.
Make fast and accurate decisions
With accurate and timely data analysis reports, business leaders can make faster and more confident decisions. Data analysis helps reduce ambiguity and risk in strategic decisions, thereby increasing the success rate of business plans.
Improve marketing and sales strategies
Data analysis provides a clear view of the effectiveness of marketing campaigns, helping businesses identify the most effective channels and adjust their strategies accordingly. Customer data helps build targeted marketing strategies, increase conversion rates, and optimize advertising costs.
3. Data analysis methods, techniques, and applications

3.1. Descriptive Analysis
Objective: To summarize and describe data to understand the current situation and provide an overview of the data’s key characteristics.
- How it’s done: Descriptive analysis does not make any predictions but only provides information about the current state. For example, you can use basic calculations like mean, median, standard deviation, or other summary statistics to describe the data.
- Application: Descriptive analysis is often used in reports on revenue, customer numbers, and sales figures for a specific period. For example, a business can use descriptive analysis to summarize monthly revenue from different departments.
Popular tools: Excel, Google Analytics, Tableau, Power BI.
Example: A retail store can use descriptive analysis to summarize total revenue for the past month and analyze the number of purchasing customers.
3.2. Predictive Analysis
Objective: To predict future events or behaviors based on historical data, helping businesses make more accurate strategic decisions.
- How it’s done: Predictive analysis uses mathematical models and machine learning algorithms to analyze past data and identify predictable trends. These models use factors such as customer behavior and market information to make forecasts.
- Application: Predictive analysis is used to make forecasts about revenue, customer purchasing behavior, or market development. For example, forecasting which products will have high consumption in the coming month.
Common tools: R, Python (Scikit-learn, TensorFlow), IBM SPSS, SAS.
Example: A retail company can use predictive analysis to forecast the number of products it will sell next month based on historical data on seasonality, market trends, and shopping behavior.
3.3. Diagnostic Analysis
Objective: To identify the cause of an event or phenomenon, in order to analyze and understand why a problem or phenomenon occurred.
- How it’s done: Diagnostic analysis requires businesses to delve deep into data to identify the factors causing a specific change or event. This method often uses correlations or analysis of past events.
- Application: Used when a business encounters a specific problem, such as a decrease in revenue or low customer return rates, and needs to find the cause. The analysis will help pinpoint which factors or behaviors led to these outcomes.
Common tools: SQL, Power BI, Tableau, R.
Example: A business can use diagnostic analysis to determine why a marketing campaign did not yield the expected results. It could be due to inappropriate timing, the wrong target audience, or an unappealing message.
3.4. Prescriptive Analysis
Objective: To provide optimal solutions for business decisions, based on data analysis and prescriptive models.
- How it’s done: Prescriptive analysis combines analytical data and optimization models to suggest the best options for specific situations. This method not only provides predictions but also suggests actions to help businesses achieve the best possible outcomes.
- Application: Prescriptive analysis is often used in situations such as selecting marketing strategies, optimizing production processes, and allocating resources.
Common tools: Google Analytics, IBM Watson, Python (SciPy, scikit-learn), MATLAB.
Example: A business can use prescriptive analysis to select the most effective marketing strategy based on customer behavior, advertising costs, and other factors.
3.5. Big Data Analysis
Objective: To process and analyze a huge and diverse amount of data, often exceeding the processing capabilities of traditional analysis tools.
- How it’s done: Big data analysis uses distributed analytics tools, powerful data storage technologies, and machine learning algorithms to process data on a large scale. These tools can analyze data from various sources and identify patterns and trends within massive volumes of data.
- Application: Big data is applied in areas such as customer behavior analysis, market trend forecasting, and fraud detection in financial transactions.
Common tools: Hadoop, Spark, NoSQL Databases, Amazon Web Services (AWS).
Example: A company can use big data to analyze the shopping behavior of global customers, thereby identifying trends and potential markets.
3.6. Machine Learning Analysis
Objective: To automatically learn and improve from data, helping businesses make accurate predictions without detailed programming.
- How it’s done: Machine learning uses algorithms to analyze data and learn from the results to improve future predictions. This method often uses algorithms such as supervised learning or unsupervised learning.
- Application: Machine learning analysis is used in customer behavior analysis, market trend prediction, and optimizing marketing campaigns.
Common tools: TensorFlow, Keras, Scikit-learn, Apache Mahout.
Example: A company can use machine learning to predict a customer’s likelihood of making a purchase, thereby recommending suitable products to each customer based on their previous behavior.
3.7. Correlation Analysis
Objective: To identify the relationship between variables in the data, thereby gaining a better understanding of the factors that affect business outcomes.
- How it’s done: Correlation analysis seeks relationships between two or more factors, helping to determine how a change in one factor might affect another. Metrics like the Pearson correlation coefficient are often used to measure this relationship.
- Application: Correlation analysis can be used to understand the link between marketing campaigns and revenue, price and customer purchasing behavior, or the relationship between service quality and customer satisfaction.
Popular tools: Excel, R, Python (Pandas).
Example: Correlation analysis can help a business recognize the relationship between advertising campaigns and revenue, thereby optimizing its marketing strategy.
4. The Data Analysis Process
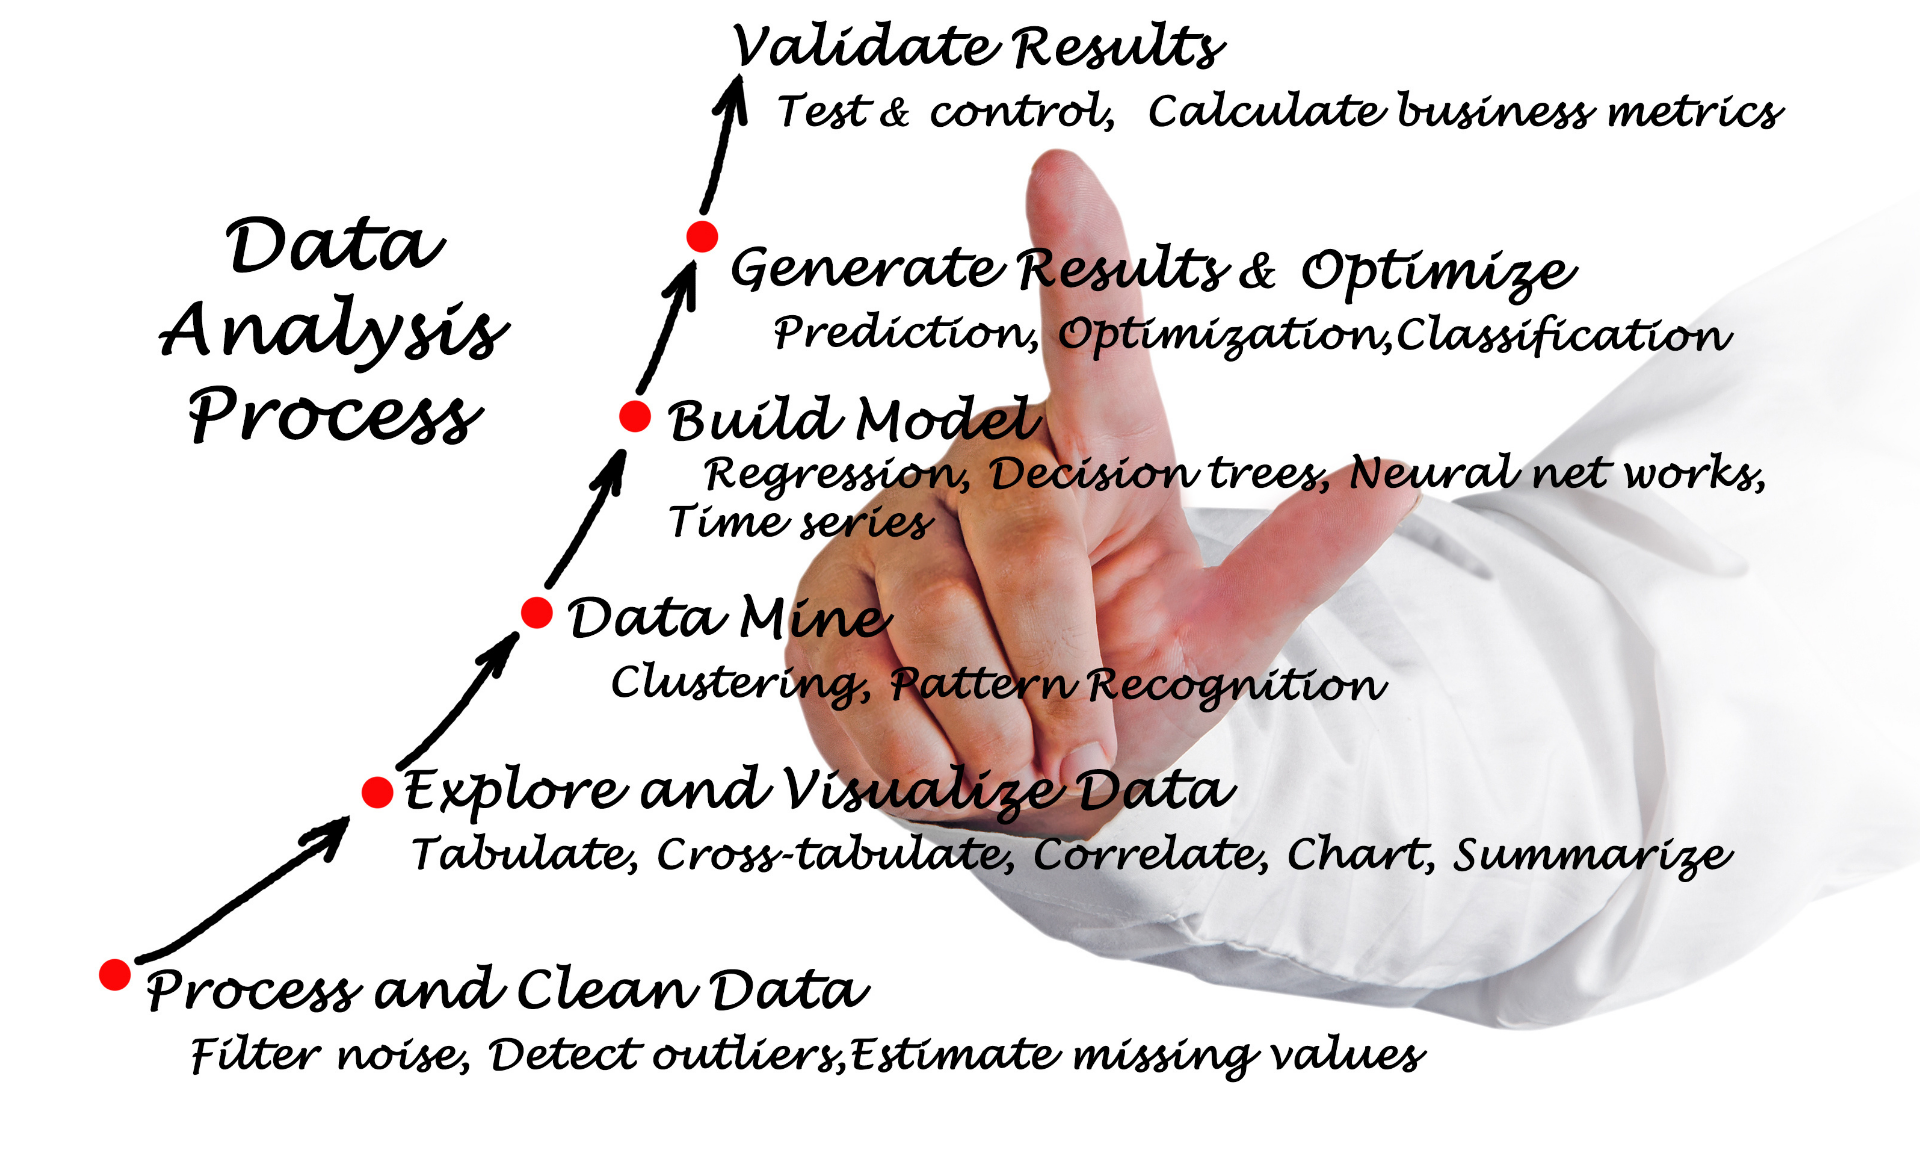
The data analysis process is a series of consecutive steps that help transform raw data into valuable information to support decision-making. To ensure effective and accurate analysis, this process must be carried out systematically and follow the correct steps. Below are the basic steps in the data analysis process:
Step 1: Define the Problem and Analysis Objectives
Before you begin, it is crucial to clearly define the problem to be solved and the analysis objectives. The questions you need to answer are:
- What is the objective of the analysis? Are you looking to improve work efficiency, predict market trends, or find the cause of a problem?
- What problem needs to be solved? This step is to clearly understand the purpose of the analysis, which helps in determining the appropriate analysis methods and techniques.
Example: A business might define its analysis objective as increasing revenue in the next quarter by analyzing customer purchasing behavior.
Step 2: Collect Data
After defining the problem and analysis objectives, the next step is to collect data. Data can come from various sources, including:
- Internal data: Financial reports, sales data, customer information from the CRM system.
- External data: Market data, industry research, information from partners, or public data.
Note: Ensure that the collected data is complete, accurate, and regularly updated.
Example: A business can collect data on customer purchasing behavior from its sales system and e-commerce platforms.
Step 3: Clean and Prepare Data
Collected data is often imperfect and may contain errors such as missing values, inconsistencies, or duplicates. Data cleaning is the process of eliminating these issues and preparing the data for accurate analysis.
- Remove invalid data: Missing, inaccurate, or incorrectly formatted data.
- Handle missing values: Missing values can be filled in through estimation (imputation) or by removing the incomplete data.
- Standardize data: Ensure that units of measurement and data formats are consistent.
Example: A customer data table might contain missing information such as addresses or birth dates. These fields need to be cleaned before analysis.
Step 4: Analyze Data
Once the data is prepared, the next step is to analyze it. Depending on the objectives and type of data, you can use various analysis methods, such as:
- Descriptive analysis to summarize data.
- Predictive analysis to identify future trends.
- Diagnostic analysis to determine the cause of a problem.
- Prescriptive analysis to provide optimal solutions.
Example: If you want to analyze customer behavior, you can use descriptive analysis to find common behavior patterns and predictive analysis to forecast products customers might buy in the future.
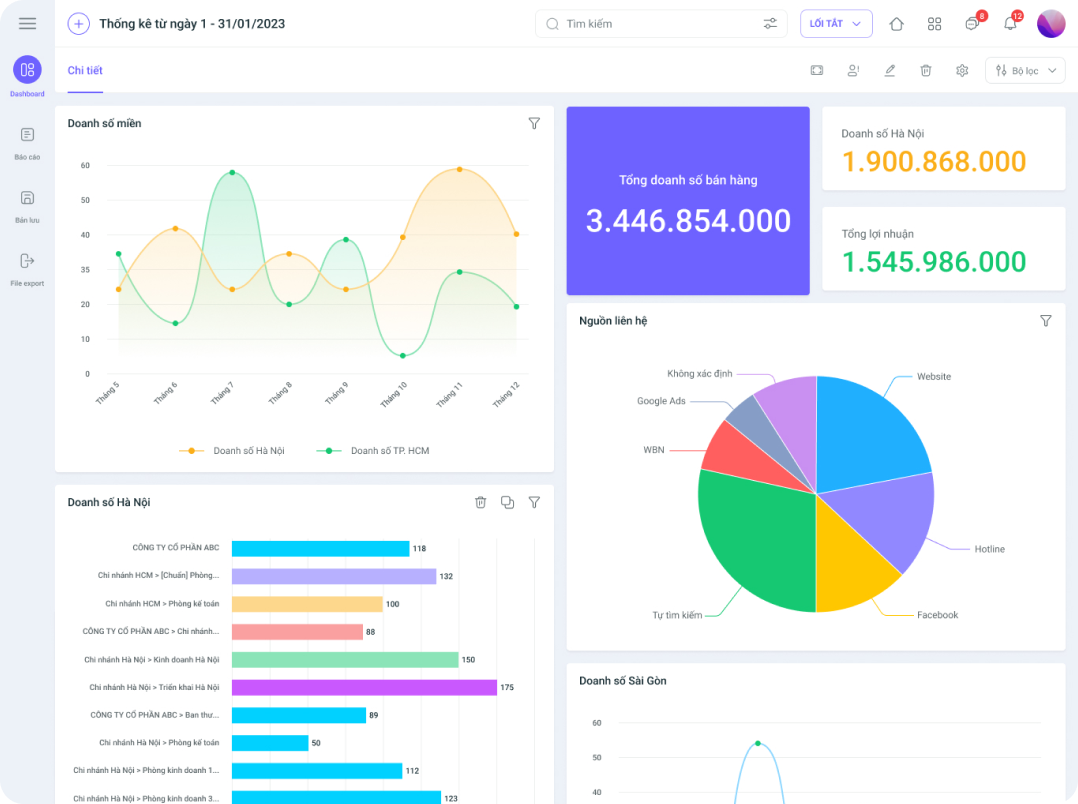
Step 5: Present the Analysis Results
After analyzing the data, the next crucial step is to present the results clearly and understandably. This helps managers or business leaders easily absorb the information and make decisions.
Common presentation formats include:
- Reports: Including tables, charts, and detailed analysis.
- Dashboards: A visual tool to monitor key metrics.
- Charts and graphs: Help illustrate data visually and make it easy to understand.
Example: A business can use a dashboard to visually present monthly revenue, conversion rates, and customer information.
Step 6: Make Decisions and Take Action
Finally, based on the analysis results, the business will make specific decisions and take action. Data analysis is only valuable when it helps the business implement improvement steps, such as:
- Adjusting marketing strategies.
- Optimizing production processes.
- Improving products or services.
Example: Based on an analysis of shopping behavior, a company might decide to enhance its advertising campaigns for products favored by customers.
Step 7: Evaluate and Adjust
After implementing the decisions, the final step in the data analysis process is to evaluate the results. The business needs to monitor and measure the effectiveness of decisions based on the analyzed data. If the results do not meet expectations, the business can adjust its strategy and continue analyzing data for improvement.
Example: If a marketing campaign does not yield the expected results, the business needs to re-analyze the factors and adjust the strategy.
5. Key Considerations for Business Data Analysis
Ensure Data Accuracy and Completeness
One of the key factors determining the success of data analysis is data quality. Inaccurate, incomplete, or biased data can lead to incorrect conclusions and negatively impact business decisions. Therefore:
- Collect data from reliable sources and ensure that the data is complete, accurate, and regularly updated.
- Check the data before use to eliminate errors and inconsistencies such as missing or invalid values.
Example: When analyzing customer behavior, customer data must be collected from a legitimate CRM system and be error-free.
Clearly Understand the Analysis Objectives
Before starting the analysis, clearly define the objectives you want to achieve. This will help:
- Select the appropriate analysis method, such as descriptive, predictive, or diagnostic analysis.
- Save time and resources by focusing on issues that are truly important to the business.
Example: If the objective is to forecast revenue, you will need to use predictive analysis instead of descriptive analysis.
Choose the Appropriate Analysis Method
Depending on the data type and analysis objective, the business needs to choose the appropriate analysis method to achieve accurate results. Methods like descriptive analysis, predictive analysis, or machine learning can yield different outcomes, so selecting the right method is crucial.
Example: If you are investigating the cause of a revenue decline, you can use diagnostic analysis. If you need to predict sales trends, predictive analysis will be more effective.
Ensure Security and Regulatory Compliance
When processing and analyzing data, especially customer data, ensuring security is crucial. Privacy violations can have serious consequences for both the business and its customers. Therefore:
- Comply with security regulations such as GDPR (General Data Protection Regulation) or other security regulations depending on the region of operation.
- Implement security measures such as encryption and data protection during storage and processing.
Example: If analyzing customer data, the business must ensure that customers’ personal information is kept secure and is not disclosed.
Control the Data Sample
When analyzing data, using a representative data sample is crucial to ensure accurate analysis results. A non-representative sample can lead to biased results and flawed business decisions.
- Use a random or representative sample to minimize bias and ensure that the analysis results can be applied to the entire dataset.
Example: If you are analyzing customer shopping behavior during a holiday season, ensure the data sample includes a sufficient range of customer groups from different segments, not just a small group.
Evaluate Results and Adjust as Necessary
After completing the analysis, don’t forget to evaluate the results to see if they accurately reflect reality and support business objectives. If the results are not as expected, adjust the analysis method or improve the data.
- Review the factors affecting the analysis results and re-test the models if necessary.
Example: If the revenue forecast is inaccurate, you may need to adjust factors in the predictive model, such as customer behavior or marketing strategies.
Present Results Clearly and Comprehensibly
Although data analysis can be very complex, presenting the results clearly and understandably is crucial, especially for managers or CEOs who are not data analysis experts.
- Use easy-to-understand charts, tables, and reports to convey the analysis results.
- Summarize key points and indicate the actions that need to be taken based on the analysis results.
For example: If the analysis results indicate that the marketing campaign needs improvement, you should present the specific areas that need to be changed in the report, along with specific solutions and recommendations.
Repeat the Analysis Process Periodically
Data analysis is a continuous and iterative process. Data is always changing, and external factors such as the market, customer needs, and the business environment can impact the results. Therefore, businesses need to repeat the analysis process periodically to update strategies and adjust plans as needed.
For example: A retail company might analyze customer behavior at the end of each season to update its sales and marketing strategies for the next season.
6. Challenges in Applying Data Analysis in Business
Incomplete and Inaccurate Data
One of the biggest challenges in data analysis is incomplete, inaccurate, or inconsistent data. This can lead to skewed analysis results, which in turn affects strategic decisions.
Solution:
- Improve the data collection process: Ensure that data is collected from reliable sources and is regularly checked to maintain quality.
- Use data cleaning tools: Utilize software or automated tools to clean data, detecting and handling missing or incorrect data.
- Train employees: Ensure that the team collects and processes data correctly, avoiding data entry errors.
Lack of Professional Resources
Data analysis requires in-depth knowledge of statistics, programming, and data analysis tools. If a business lacks a specialized team, applying data analysis will be challenging.
Solution:
- Train employees: Provide training courses on data analysis and the use of popular analysis tools for staff.
- Hire experts or consultants: If in-house training is not immediately feasible, businesses can hire consultants or partner with specialized data analysis firms for the initial implementation.
Difficulty in Choosing the Right Analysis Method
Choosing an analysis method that aligns with business goals and data types can be a major challenge. Different methods can yield different results, and applying the wrong method can lead to incorrect decisions.
Solution:
- Clearly define analysis goals: Before starting the analysis, clearly define the objectives you want to achieve to select the appropriate method.
- Test and compare methods: Experiment with several different methods on the same dataset and evaluate the results to choose the most effective one.
Costs and Necessary Resources
Data analysis requires investment in software tools, hardware, and specialized personnel. This can be a barrier for small or new businesses.
Solution:
- Use open-source software: Open-source data analysis tools like R, Python, and Apache Hadoop can help save costs while still delivering effective results.
- Start with basic tools: Businesses can begin with basic data analysis tools like Google Analytics, Excel, or Power BI before investing in more complex systems.
- Apply data analysis in phases: Businesses can implement data analysis in stages, starting with simple analyses and gradually expanding as resources become available.
Integrating Data from Different Sources
A major challenge in data analysis is integrating data from various sources such as CRM, sales systems, social media, or external data. This integration can be difficult if the data is incompatible or not properly structured.
Solution:
- Use data integration tools: Tools like 1Office, Zapier, Integromat, or Talend help connect and synchronize data from different sources easily.
- Build a Data Warehouse: Set up a dedicated data warehouse to integrate and store all data from different systems, making it easier for the business to access and analyze.
7. Data Analysis Support Tools
Power BI
Power BI is one of the most powerful and popular data analysis tools, used to aggregate data from various sources and create visual reports. With its visualization and interactive capabilities, Power BI helps users easily understand key business trends and metrics.
- Application: Power BI is often used to create dynamic reports, track business performance, and analyze data from ERP, CRM, and other systems.
Tableau
Tableau is a prominent data analysis tool that helps visualize data in an intuitive and easy-to-understand way. Tableau provides interactive charts and customizable dashboards, making it easy for users to analyze and draw conclusions from data.
- Application: Tableau can connect to various data types and helps analyze business trends, thereby supporting strategic decisions.
1Office Software
1Office is an AI-integrated business management software that helps businesses easily aggregate, retrieve, and analyze data from various sources. This software can connect and process data from different departments within the business, including sales, marketing, finance, and human resources.
Register for a free feature Demo!
- Data aggregation and retrieval: 1Office helps businesses aggregate data from various sources and retrieve information quickly, saving time and minimizing the risk of using inaccurate data.
- AI-powered data analysis: 1Office integrates AI to analyze data and provide smart forecasts and recommendations. AI can analyze customer trends, forecast revenue, and optimize business processes. This helps managers and CEOs make decisions based on real data rather than just intuition.
- Report and dashboard creation: The software provides custom reports and intuitive dashboards to track key business indicators, helping managers get a comprehensive view of business operations.
- Connection and integration: 1Office can integrate with other systems in the business, such as accounting software, helping to consolidate data from different departments for accurate analysis and decision-making.
Example: Suppose you are a CEO and want to forecast revenue for the next quarter. 1Office will automatically analyze past sales data, customer behavior, and market factors to provide a revenue forecast for the upcoming quarter.
AI application in decision-making: By using AI technology, 1Office helps businesses make smarter decisions, from planning to cost optimization, enhancing customer experience, and improving work efficiency.
8. The future of data analysis in business
The Growth of Big Data
Big data will continue to expand and become a crucial factor in the data analysis process. With the constant increase in the amount of data businesses collect from sources like social media, IoT sensors, online transactions, and mobile applications, the ability to process and analyze big data will become a mandatory requirement.
- Forecast: Businesses will have to invest in technologies like Hadoop, Apache Spark, and NoSQL databases to handle massive data volumes, while also using more powerful data analysis tools to extract value from large and unstructured datasets.
Integration of Artificial Intelligence (AI) and Machine Learning
Artificial intelligence (AI) and machine learning will deeply penetrate data analysis, helping businesses automate analytical processes and make more accurate predictions. AI algorithms will be able to learn from data and make intelligent decisions without human intervention.
- Forecast: AI and machine learning will help businesses improve predictive analysis capabilities, detect hidden patterns in data, and optimize workflows. Companies will increasingly use automated systems to analyze data and support real-time decision-making.
Real-Time Data Analytics
With the development of cloud data storage and rapid data transmission technologies, real-time data analysis will become a major trend. Businesses will be able to make faster and more accurate decisions by analyzing data in real-time, instead of waiting for delayed analysis results.
- Forecast: Businesses will implement real-time data analysis systems to monitor key business indicators and respond quickly to changes in the business environment.
Automated Data Analytics
Automation will be one of the prominent trends in future data analysis. Data analysis tools will automate stages from data collection to result presentation, helping to minimize human intervention and save time for businesses.
- Forecast: Analytical tools will become increasingly automated, helping businesses minimize costs and increase work efficiency. Systems will be able to automatically generate reports, identify trends, and make predictions without user intervention.
Integrating Data from Multiple Sources
Businesses will increasingly integrate data from various sources, including data from social media platforms, IoT (Internet of Things) devices, mobile applications, and external data sources. This integration helps create a more comprehensive picture of customer activities and needs.
- Forecast: Analytical tools will be improved to help businesses easily consolidate various data sources, thereby optimizing strategies and creating new opportunities.
Data Analysis with Visualization (Data Visualization)
Data visualization will continue to play an important role in helping businesses understand data and make accurate decisions. Visualization technology will make data easier to understand, allowing users to easily access important information.
- Forecast: Data visualization tools like Tableau, Power BI, and QlikView will continue to evolve, offering dynamic charts and interactive dashboards to help businesses make quick decisions.