What is the IFE Matrix? How to Build It and Examples from Large Enterprises
The IFE Matrix (Internal Factor Evaluation Matrix) is a foundational tool in strategic analysis, helping businesses gain a clear picture of their internal environment through key strengths and weaknesses. In this article, we will clarify what the IFE matrix is, how to build a proper IFE matrix, and look at examples from large corporations to understand its practical application.
Mục lục
- 1. Overview of the IFE Matrix
- 2. What is the IFE matrix used for in strategic analysis?
- 3. Advantages and limitations of the IFE matrix
- 4. How to build an IFE matrix step-by-step
- 5. What do the results of the IFE matrix indicate?
- 6. Example of a Company’s IFE Matrix
- 6. Key Considerations When Building an IFE Matrix
- 7. Standardize Internal Data to Effectively Implement the IFE Matrix with the 1Office Platform
- Conclusion
1. Overview of the IFE Matrix
Below is some basic information to help you understand what the IFE matrix is, its structure, and how it differs from the EFE matrix:
1.1. The Concept of the IFE Matrix
The IFE (Internal Factor Evaluation) Matrix is a strategic analysis tool that helps businesses evaluate internal factors, including strengths and weaknesses, which directly impact their operational efficiency and competitive capabilities. Through this matrix, a business can gain a clearer understanding of its internal situation, enabling it to develop appropriate strategies to leverage existing advantages and address remaining limitations.
The IFE matrix was developed by Professor Fred R. David and introduced in his work, “Strategic Management.” According to his model, the IFE matrix is often used in conjunction with the EFE matrix to systematize and evaluate information gathered from the analysis of the company’s internal and external environments. This forms a crucial basis for an organization to plan and adjust its business strategy effectively.
IFE is an acronym for Internal Factor Evaluation Matrix
1.2. Differentiating Between the IFE and EFE Matrices
Both IFE and EFE are quantitative strategic analysis tools, but they differ completely in their subject of analysis:
| IFE (Internal Factor Evaluation) | EFE (External Factor Evaluation) |
|
|
Quick conclusion:
- IFE = looking inward to see what you have
- EFE = looking outward to see how the market is changing
1.3. What is the structure of an IFE matrix?
The IFE matrix is built based on the following groups of factors and evaluation indicators:
- Key internal factors: Includes all strengths and weaknesses that directly affect the company’s operational efficiency.
- Weight: Represents the importance of each internal factor, assigned a value from 0 to 1, with the total weight equaling 1.0.
- Rating: Uses a 1-4 scale to assess the company’s response to each factor: (1: major weakness – 4: major strength).
- Weighted Score: Calculated by Weight × Rating, reflecting the actual impact of each factor in the matrix.
- Variable (Internal variables): These are specific internal factors of the company such as brand, corporate culture, products, distribution channels, finance, human resources, technology, etc., that are included in the analysis.
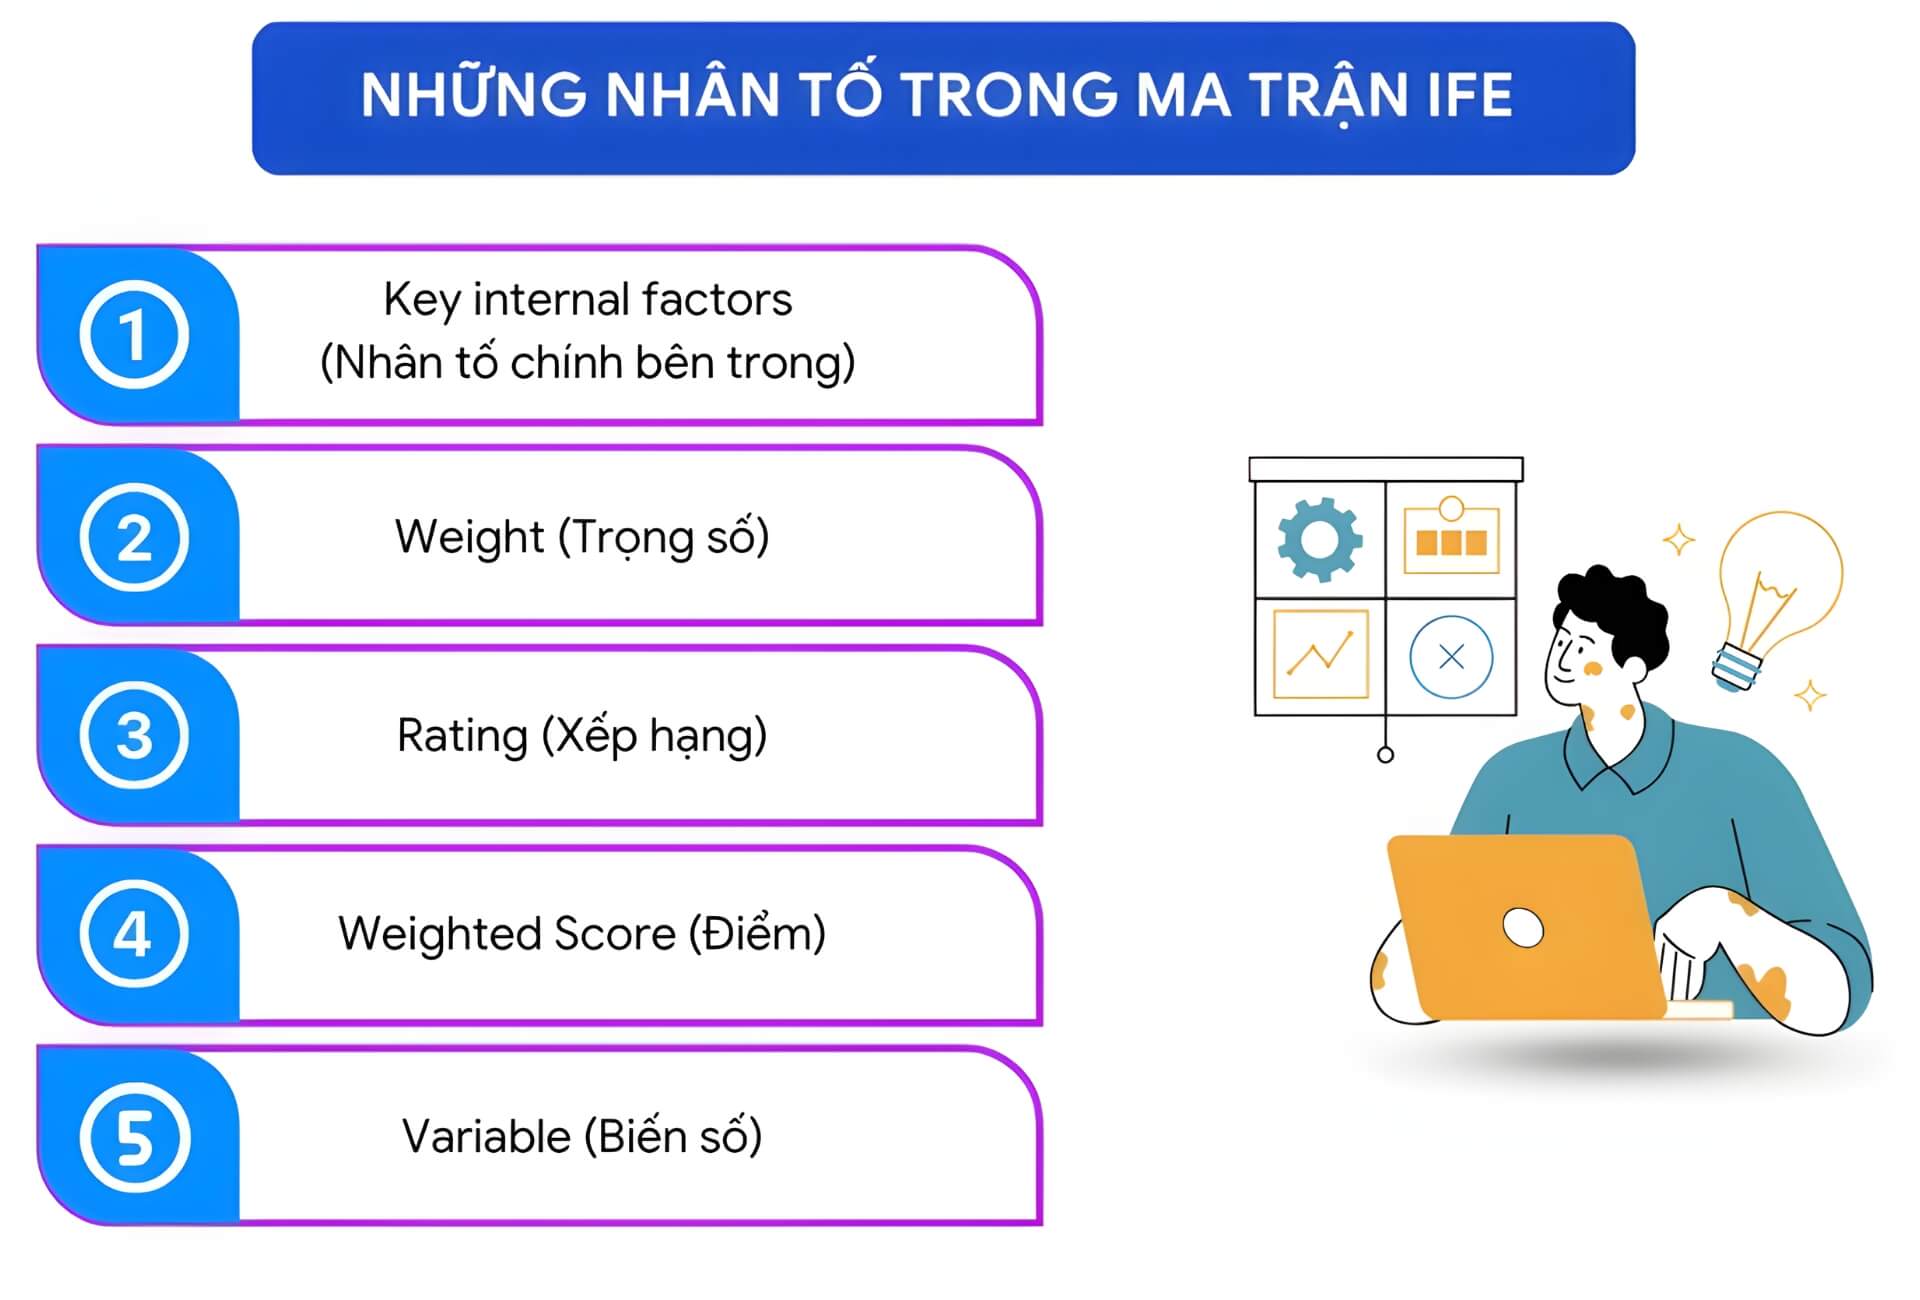
The IFE matrix is composed of 5 factors
2. What is the IFE matrix used for in strategic analysis?
Here are the core purposes and values of the IFE matrix in assessing internal capabilities and supporting strategic planning.
- Assess overall internal capabilities: Helps businesses clearly see the internal factors that directly affect operational efficiency and competitive capacity, from resources and processes to management capabilities.
- Identify core strengths and weaknesses: Points out which advantages to leverage and which limitations to improve, based on the actual impact of each factor.
- Provide a basis for building suitable strategies: Supports businesses in selecting and adjusting development strategies based on internal capabilities, avoiding strategies that exceed their actual capacity.
- Support resource allocation and optimization: Helps businesses prioritize investment in internal factors with high weights, while reducing resources for less effective activities.
- Improve the quality of management decision-making: Quantifying internal factors with scores and weights helps leadership make data-driven decisions, reducing subjectivity.
- Enhance long-term competitive advantage: When strengths are properly leveraged and weaknesses are promptly addressed, the business can build a more sustainable competitive foundation.

The IFE matrix is used to assess a company’s overall internal capabilities
3. Advantages and limitations of the IFE matrix
Here are the notable advantages and limitations to consider when applying the IFE matrix in practice:
3.1. Advantages of the IFE matrix
The IFE matrix offers significant value in the process of analyzing a company’s internal strategy, with key benefits including:
- Systematic analysis of internal factors: Strengths and weaknesses are listed, weighted, and scored clearly, helping the business identify which factors to prioritize for improvement or leverage.
- Visually represents the impact of each factor: Through the total weighted score, the business can quickly assess its internal situation and the impact of each factor on operational efficiency.
- Supports strategy formulation and adjustment: The results from the IFE matrix help the business recognize advantages to exploit and limitations to overcome, providing a basis for developing a suitable strategic plan.
- Combines effectively with other analytical tools: The IFE matrix is often used in conjunction with SWOT, TOWS, or EFE to create a comprehensive picture of both the internal and external environments of the business.
- Provides a foundation for in-depth strategic analysis: IFE provides crucial input data for building the IE (Internal-External) Matrix, helping the business choose its overall strategic direction.
3.2. Limitations of the IFE matrix
Besides its advantages, the IFE matrix also has some limitations to be aware of when applying it:
- Highly dependent on subjective judgment: Identifying strengths, weaknesses, and assigning weights and ratings often relies on the analyst’s judgment, which can lead to bias if data or diverse perspectives are lacking.
- Does not fully reflect the external context: The IFE matrix focuses only on the company’s internal capabilities and does not consider external factors like the market, competitors, or industry trends. Therefore, it needs to be combined with other tools to avoid a one-sided assessment.
- Does not reflect changes over time: Internal factors can fluctuate over different periods, while the IFE matrix only provides a snapshot at a specific point in time. It needs to be updated periodically to ensure accuracy.

Advantages and limitations of the IFE matrix
4. How to build an IFE matrix step-by-step
Here are the steps to build an IFE matrix in a logical sequence, easily applicable to various types of businesses:
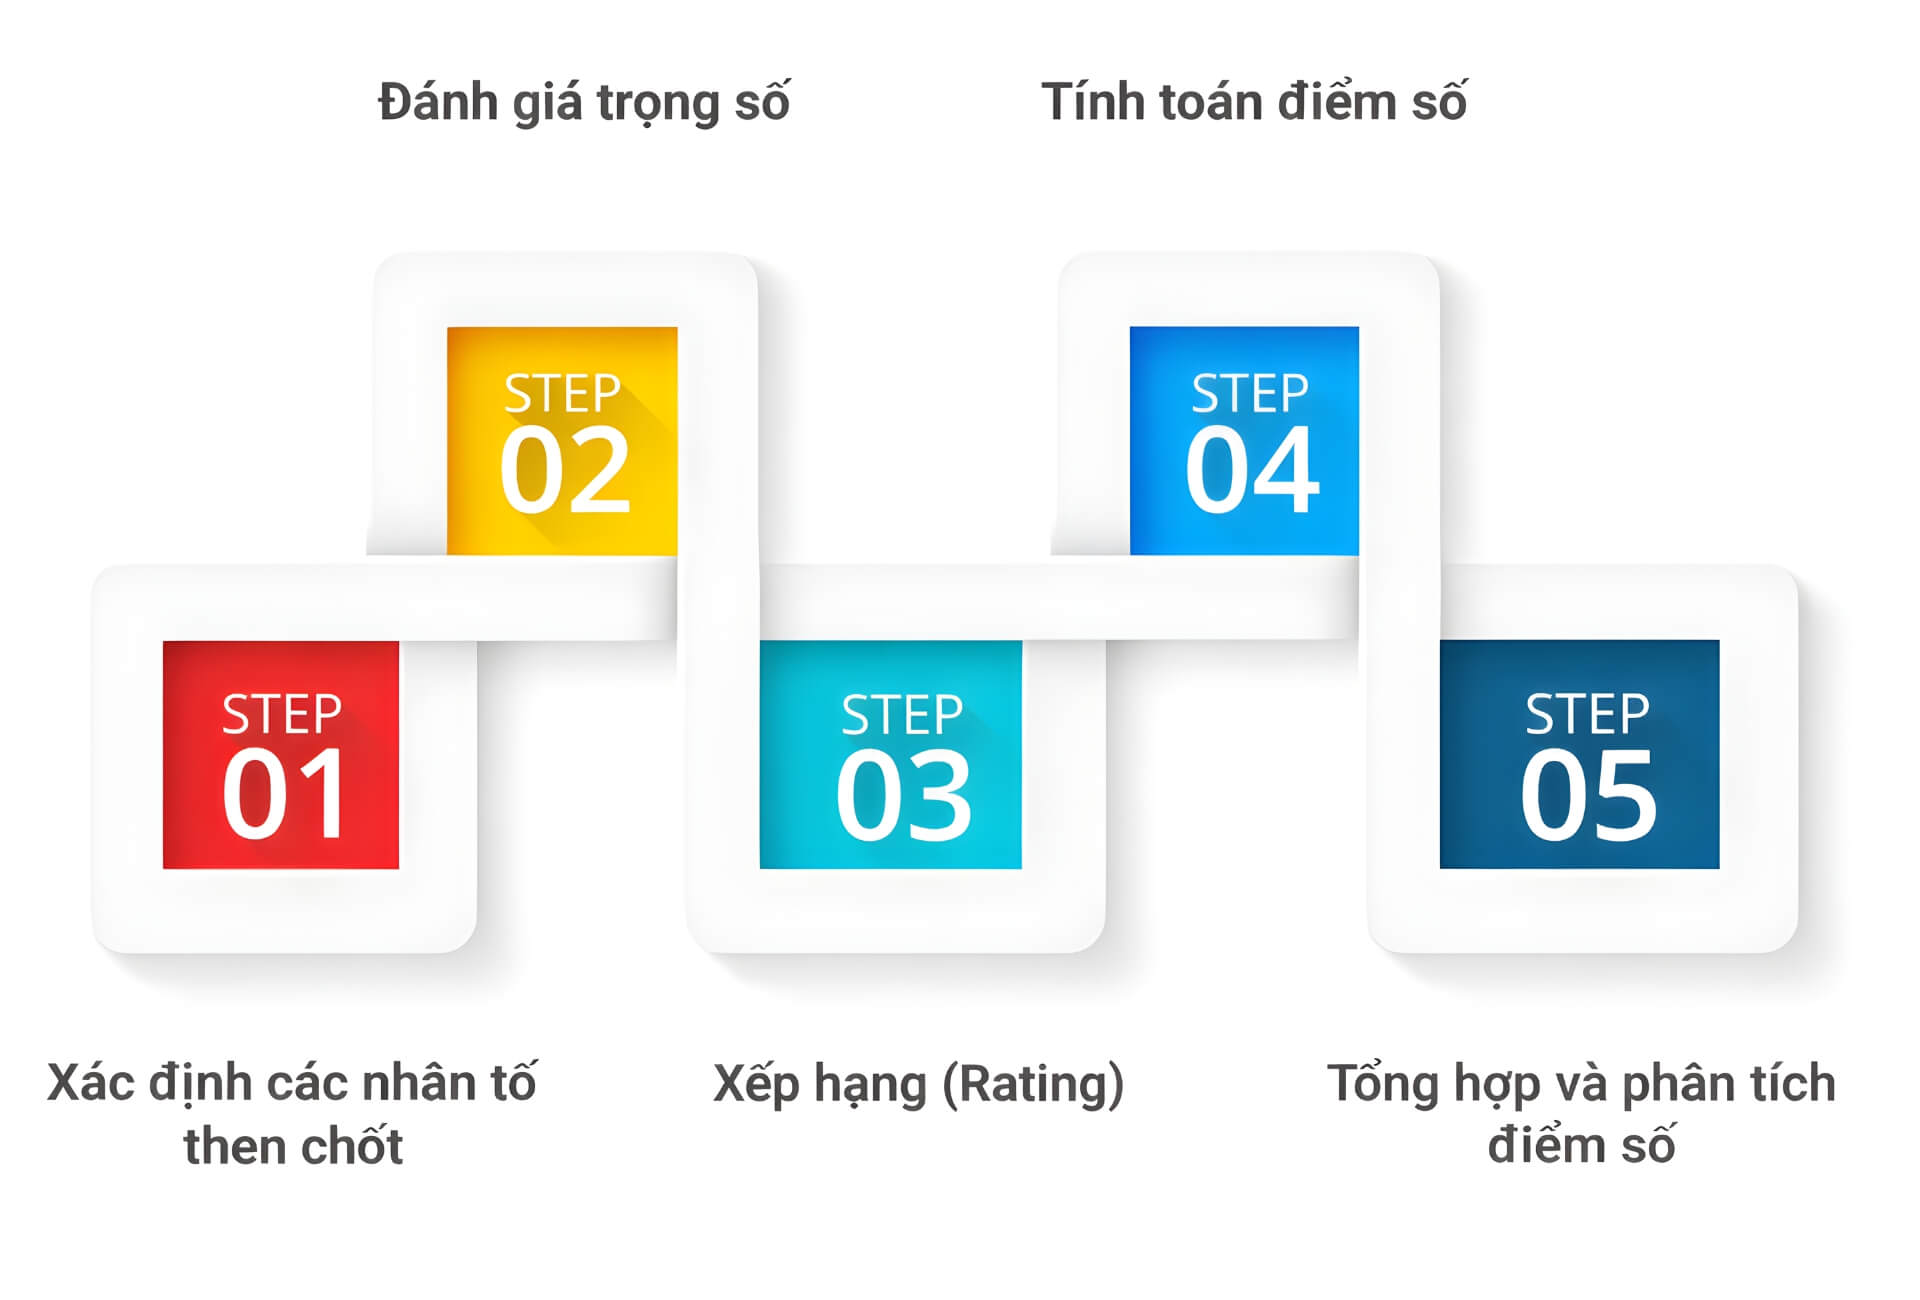
Step 1: Identify key factors
The first step in building an IFE matrix is to list about 10-20 key internal factors that directly impact the company’s operational efficiency and competitive capacity. This serves as a foundation for the business to review its internal capabilities, thereby clearly identifying which strengths to leverage and which weaknesses to improve.
In this step, each factor needs to be evaluated relatively objectively and clearly classified as:
- Stre
(1) How to determine the weight in the IFE matrix
- Use a scale from 0 to 1: Each factor is assigned a weight between 0.0 and 1.0, reflecting its relative importance. The higher the weight, the greater the factor’s influence on the company’s performance.
- The total weight of all factors must equal 1: Weights are not assessed individually but are comparative. The distribution of weights needs to be balanced among factors, ensuring the total weight for the entire matrix equals 1.
(2) Principles of weight distribution
- Strengths that can create a clear competitive advantage or directly impact growth are usually assigned a higher weight.
- Weaknesses with a minor impact or a supporting role will have a lower weight; however, “key” weaknesses can also be assigned a high weight if they strongly affect overall efficiency.
(3) Illustrative example
- Strong brand (Weight = 0.20): The brand has high recognition and is trusted by customers, playing a crucial role in maintaining and expanding market share.
- Advanced technology (Weight = 0.10): Technology helps improve productivity and quality, but in this case, it is not the decisive factor for core competitive advantage.
Step 3: Rating
After distributing the weights, the company needs to evaluate the actual operational level of each internal factor. The Rating reflects how well that factor is being utilized and how it contributes to business performance and strategic goals.
How to assign a Rating
(1) Rating scale – Each factor is scored on a scale from 1 to 4:
- 1 – Poor: Operations are ineffective, even hindering or negatively impacting the business.
- 2 – Average: Makes a certain contribution, but its effectiveness is still low and requires significant improvement.
- 3 – Good: Operates effectively, delivering clear value, but there is still room for further optimization.
- 4 – Excellent: Operates very well, creating a clear competitive advantage and playing a crucial role in overall success.
(2) Evaluation principles
- The rating must be based on the actual operational situation, not on expectations or feelings.
- Prioritize using data and specific metrics to ensure objectivity, such as:
- Customer satisfaction level
- Revenue or profit growth
- Work efficiency, labor productivity
Accurate scoring will help the IFE matrix precisely reflect the company’s internal capabilities, thereby supporting the development of more suitable strategies.
Step 4: Calculate the score
Once the weight and rating for each internal factor are established, the next step is to calculate the weighted score. This score indicates the actual impact of each factor on the company’s operational performance and overall competitive ability.
How to calculate the weighted score:
Weighted score = Weight × Rating
Where:
- Weight reflects the importance of the factor in the overall strategic picture.
- Rating indicates how well the company is leveraging that factor.
For example:
- If the “Strong Brand” factor has a weight of 0.15 and a rating of 4, then:
- → Weighted score = 0.15 × 4 = 0.60
Step 5: Aggregate and analyze the scores
After calculating the weighted score for each factor, the final step is to aggregate and analyze the data to assess the company’s overall internal picture. The results from this step will be a crucial basis for orienting the development strategy for the next phase.
(1) Calculate the total IFE score: Sum all the weighted scores of the factors in the matrix to determine the Total IFE Score.
Total IFE Score = Total weighted score of all factors
(2) Interpreting the total IFE score
- From 1.0 – below 2.5: The business has many internal weaknesses, low operational efficiency, and needs significant restructuring to improve its competitive capabilities.
- From 2.5 – 3.0: The internal environment is relatively balanced between strengths and weaknesses. The business has a stable foundation but still needs optimization for more sustainable development.
- Above 3.0: The business possesses many internal advantages, is in a strong position, and has the ability to leverage its strengths to expand its market or increase its competitive capabilities.
(3) Detailed analysis of each factor
- Strengths group: High-scoring factors are the foundation for long-term advantages. The business should continue to invest in and deeply exploit them, such as by developing the brand, improving personnel quality, or optimizing core competencies.
- Weaknesses group: Low-scoring factors should be prioritized for improvement. For example, if technology or operating costs are weaknesses, the business needs to consider upgrading systems or restructuring processes.
(4) Identify key strategic factors: Combine the total IFE score with the weight of each factor to determine which factors have the greatest impact on business results. This is the group of strategic factors that the business needs to focus its resources on to improve or leverage in the next phase.

How to build an IFE matrix step-by-step
5. What do the results of the IFE matrix indicate?
The IFE matrix allows a business to systematically assess the strength and weakness of its internal capabilities through a weighted score, ranging from 1.0 to 4.0. This index reflects the company’s internal position relative to its competitors as well as its strategic goals.
- Total score below 2.5: Internal capabilities are weak, with many limitations that need to be addressed promptly to avoid impacting competitiveness and growth.
- Total score of 2.5 or higher: The business possesses certain internal advantages, but still needs to continue optimizing to improve operational efficiency.
Below is an illustrative example to help you easily understand how to read and analyze the results of an IFE matrix:
Internal Factors
Weight Rating Weighted Score Strengths Well-known brand 0.25 4 1.0 Wide distribution system 0.20 3 0.6 Good R&D capabilities 0.15 4 0.6 Weaknesses High production costs 0.20 2 0.4 Ineffective marketing strategy 0.10 2 0.2 High employee turnover rate 0.10 1 0.1 Total 1.0 2.9 With a total IFE score of 2.9, the company is assessed as having relatively strong internal capabilities, excelling in factors such as brand and distribution system—crucial foundations for maintaining a competitive advantage.
However, the results also highlight some issues that need to be prioritized for improvement:
- High production costs (0.4): The company should consider optimizing processes, improving technology, or renegotiating with suppliers to reduce costs.
- High employee turnover rate (0.1): This is a serious weakness that needs to be addressed with appropriate HR policies, such as improving benefits, the work environment, and providing a clear career development path.
This example shows that the IFE matrix not only helps assess internal strengths but also supports businesses in identifying the right focus for improvement and strategic investment.
6. Example of a Company’s IFE Matrix
Below is an illustrative example of a specific company’s IFE matrix to help you visualize how to apply it in practice:
Example 1: Vinamilk’s IFE Matrix
Vinamilk’s IFE Matrix Table
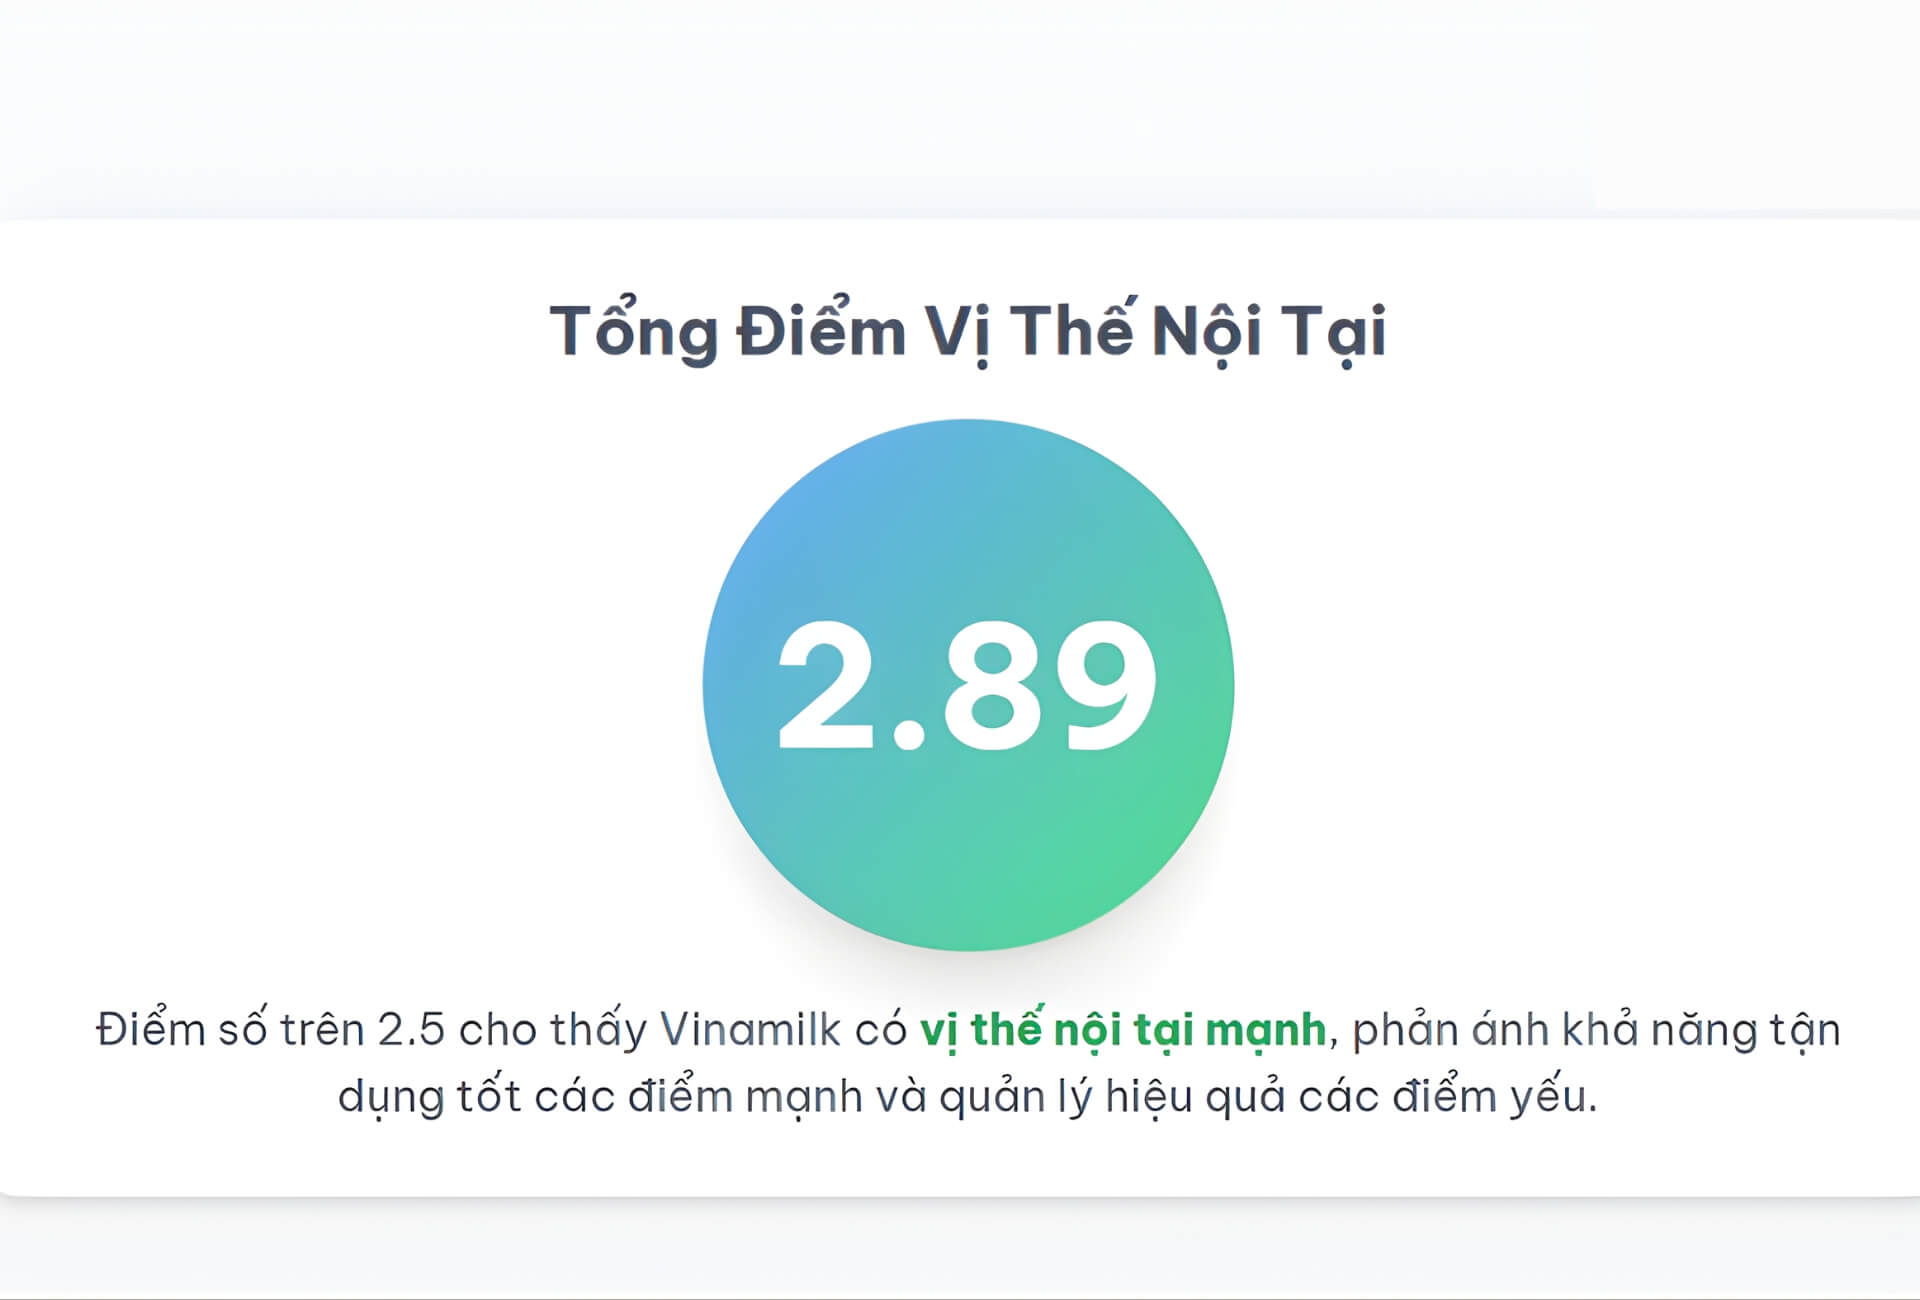
No. Key Internal Factors Weight Rating Weighted Score Strengths Strong and reputable brand 0.15 4 0.60 Extensive distribution system 0.12 4 0.48 Diverse product range 0.10 3 0.30 Modern production technology, strict quality management 0.08 3 0.24 Strong financial resources 0.07 4 0.28 Stable raw material source (farms) 0.06 3 0.18 Professional and experienced team 0.05 3 0.15 Weaknesses Dependence on imported raw materials 0.10 2 0.20 Intense market competition 0.10 2 0.20 Pressure for product and technology innovation 0.09 2 0.18 Brand and reputation risks 0.05 1 0.05 Limited international business operations 0.03 1 0.03 Total 1.00 2.89 Total Score and Assessment of Vinamilk’s Internal Position According to the IFE Matrix
(1) Total IFE Score: 2.89 (higher than the average of 2.5) → Vinamilk possesses a fairly strong internal position, a good internal foundation, and the ability to effectively leverage existing resources.
(2) Factors Creating Core Strengths:
- Reputable, market-leading brand
- Extensive distribution system
- Strong financial capacity
- Diverse product portfolio
- Modern production technology, strict quality management
- Relatively stable raw material supply from the farm system
- Experienced team of personnel
→ These factors help Vinamilk maintain its competitive advantage, stabilize market share, and expand its scale of operations.
(3) Limitations to Note in Strategy:
- Dependence on imported raw materials → risk of price fluctuations and supply chain disruptions
- Increasingly fierce competition in the market
- Pressure for continuous product and technology innovation
(4) Factors to Consider in the Long Term:
- Risks to brand and reputation
- Limited scale of international operations
→ Although their impact on the score is not yet significant, these factors need to be addressed to protect brand value and expand the potential for sustainable growth.
Vinamilk’s IFE matrix
See more:
- Vinamilk’s SWOT: Detailed Analysis of Business Strategy
- Vinamilk’s HR Policy: Culture, Benefits, Opportunities
Example 2: TH True Milk’s IFE Matrix
TH True Milk’s IFE Matrix Table
Key Internal Factors Weight Rating Weighted Score Strengths Reputable “clean milk” brand 0,15 4 0,60 Modern technology and production processes 0,12 4 0,48 Self-sufficient raw material supply 0,10 4 0,40 R&D capabilities and product diversification 0,08 3 0,24 Extensive distribution system 0,07 3 0,21 Strong financial potential 0,08 4 0,32 Effective marketing & communication 0,09 4 0,36 Corporate culture and leadership vision 0,05 4 0,20 Weaknesses High product cost 0,06 2 0,12 High operating and management costs 0,05 2 0,10 Dependence on imported technology and breeds 0,04 2 0,08 Limited coverage in rural areas 0,04 1 0,04 Product portfolio less diverse than competitors 0,03 2 0,06 Risks in supply chain management 0,02 2 0,04 Low flexibility in pricing strategy 0,02 1 0,02 TOTAL 1,00 3,27 Interpreting the results from TH True Milk’s IFE matrix
(1) Total IFE Score: 3.27 (higher than the average of 2.5) → TH True Milk possesses a very strong internal foundation, with the ability to effectively leverage its core advantages and relatively efficiently control its limitations.
(2) Key Internal Factors
- “Clean milk” brand (0.60): The most important strategic advantage, creating clear differentiation and a significant competitive barrier. All long-term activities should focus on protecting and reinforcing trust in quality and “cleanliness”.
- Modern technology and production processes (0.48): Affirms the right investment direction, helping TH maintain stable quality and a sustainable competitive advantage.
- Self-sufficient raw material source (0.40): Increases quality control from the source, while also building significant trust as consumers are highly concerned about food safety.
(3) Weaknesses to Prioritize for Improvement
- High product price (0.12): Affects the ability to expand market share, especially with price-sensitive customer groups. The company could consider smaller-volume product lines or a more flexible cost structure.
- Limited coverage in rural areas (0.04): Despite the low weight, the rating indicates this is a strategic gap. The rural market still has room for growth with a suitable distribution model.
(4) General Strategic Implications: The IFE matrix shows that TH True Milk stands on a solid internal foundation, capable of pursuing a differentiation strategy based on quality, technology, and a closed-loop value chain. However, to scale up and achieve more sustainable growth, the company needs to simultaneously address the challenges of price accessibility and market coverage, especially in non-urban areas.
IFE matrix of TH True Milk
Example 3: Coca Cola’s IFE Matrix
Coca Cola’s IFE matrix table
Key Internal Factors Weight Rating Weighted Score Strengths Leading global brand with high recognition and value 0,15 4 0,60 Superior global distribution and logistics system 0,13 4 0,52 High-level marketing and advertising capabilities 0,10 4 0,40 Continuously diversified product portfolio 0,08 3 0,24 High level of customer loyalty 0,08 4 0,32 Strong financial foundation 0,09 4 0,36 Weaknesses High dependence on carbonated soft drinks (CSD) product group 0,10 2 0,20 Negative health-related perceptions (high sugar content) 0,12 1 0,12 Strong competitive pressure from global rivals and local brands 0,06 2 0,12 Challenges in water resource management and environmental impact (plastics) 0,05 2 0,10 Sensitivity to foreign exchange rate fluctuations 0,04 2 0,08 TOTAL 1,00 3,06 Interpreting the results from Coca-Cola’s IFE matrix
(1) Total IFE Score: 3.06, indicating a significantly positive internal picture for the company.
(2) Superior Internal Position: With a score significantly higher than the average of 2.5, Coca-Cola is assessed as having a very strong internal foundation. The company effectively leverages its existing advantages and is capable of offsetting and controlling its current weaknesses.
(3) Core Advantages are Effectively Leveraged:
Key factors such as brand value, global distribution network, and marketing capabilities all have high weights and are rated at 4 – a major strength. This reflects that the leadership has correctly identified strategic pillars and is consistently leveraging them. These three factors alone contributed 1.52 points, accounting for more than half of the total IFE score.
(4) Health-related Weaknesses Remain a Notable Risk:
Despite the high overall score, the factor related to negative health perceptions remains the biggest limitation. This factor has a high weight but is only rated 1, indicating that current solutions have not fully addressed the issue. This continues to be a strategic risk that could affect Coca-Cola’s long-term growth and lower the matrix’s overall score.
Coca-Cola’s IFE Matrix
6. Key Considerations When Building an IFE Matrix
Note 1 – Objectivity is a prerequisite when creating an IFE matrix
Evaluating internal factors requires honesty and clear-headedness, absolutely avoiding the tendency to “sugarcoat” or make subjective judgments. When evaluators are biased towards their own departments or avoid pointing out clear weaknesses, the IFE matrix will no longer accurately reflect the company’s true situation, leading to the risk of strategic misdirection.
Therefore, an effective approach is to organize workshops or discussion sessions with participation from multiple departments, from leadership to operational teams. A multi-faceted perspective helps make the evaluation results more realistic and reduces “illusions of internal strength.”
Note 2 – Do not use the IFE in isolation; it should be part of a comprehensive analysis system
The IFE is a foundational tool, but it should not be used independently or considered the sole method of analysis. To get a more comprehensive picture, businesses should combine the IFE with complementary models such as:
- VRIO: Assesses competitive advantage based on value, rarity, imitability, and organization.
- BSC (Balanced Scorecard): Views business performance through 4 perspectives: financial, customer, internal processes, and learning & growth.
- Core Competency: Identifies the core capabilities that create sustainable differentiation.
This combination helps businesses have a clear quantitative basis while adding qualitative depth, thereby building a strategy that is realistic, feasible, and aligned with internal capabilities.
7. Standardize Internal Data to Effectively Implement the IFE Matrix with the 1Office Platform
The IFE matrix is only truly valuable when the input data is standardized. Unsynchronized, duplicated, or subjective data will lead to flawed assessments and inaccurate strategic decisions.
In this context, 1Office serves as an internal data hub with an all-in-one management model, integrating:
- HRM: personnel data, capabilities, employee turnover
- Workplace: work progress, KPIs, projects
- CRM: sales figures, customers, business performance
- Centralized reporting & analytics system
Starting in 2025, the integration of AI Agents will help automatically collect, synthesize, and detect data anomalies, supporting businesses in building an IFE matrix based on real data rather than subjective feelings.
By seamlessly integrating functions from financial management, HR, and sales to customer care, 1Office helps businesses form a comprehensive and cohesive picture of their operations. This provides companies with a complete and reliable database to accurately identify internal strengths and weaknesses.
Standardize internal data to effectively implement the IFE matrix with the 1Office platform
Conclusion
Through the IFE matrix, businesses can systematically evaluate their internal strengths and weaknesses, providing a basis for subsequent strategic decisions. When built on standard data and objective analysis, the IFE matrix is not just an evaluation tool but also a crucial foundation for guiding sustainable development.