20+ Business Management Chart Templates to Optimize Operations
A business management chart, or organizational chart, is a diagram that briefly describes the organizational structure, relationships, and responsibilities between departments and positions within a business. All businesses need to build a business management chart to clearly understand the organizational structure, create clarity about the roles and responsibilities of each member, and enhance collaboration and work efficiency. However, are you unsure how to build a business chart? Don’t worry! In the article below, 1Office will share with you the top 20+ most effective business management chart templates today. Check them out now!
Mục lục
- What is a Business Management Chart? The Role of a Business Management Chart
- How is a Business Management Chart Built?
- Popular Business Management Chart Templates Today
- Corporate Governance Chart Templates by Business Type
- Corporate Governance Chart Templates by Department
- Sample Business Management Organizational Charts by Industry
- Common mistakes when designing a business management organizational chart
- How does a management structure impact partner and customer relationships?
- What are the criteria for evaluating the effectiveness of a management structure?
- How to effectively manage a business management chart with 1Office software
- Frequently Asked Questions
What is a Business Management Chart? The Role of a Business Management Chart
In any organization, clearly understanding who is in charge, who reports to whom, and how departments are interconnected is a decisive factor for operational efficiency. This is why the business management chart (organizational chart) was created. It is not just a simple drawing describing the organizational structure; the management chart also illustrates the distribution of authority, responsibility, and information flow throughout the company. A well-built and clear chart helps managers lead more easily, allows employees to understand their positions, and supports the business in optimizing resources and improving work performance.
1. Definition
A business management chart, or organizational chart, is a visual diagram that describes the management structure and business management system. Each management chart provides information related to management levels, departments, functions, relationships, as well as the authority and responsibilities of each member in the organization. This gives the business a comprehensive view of its management structure.
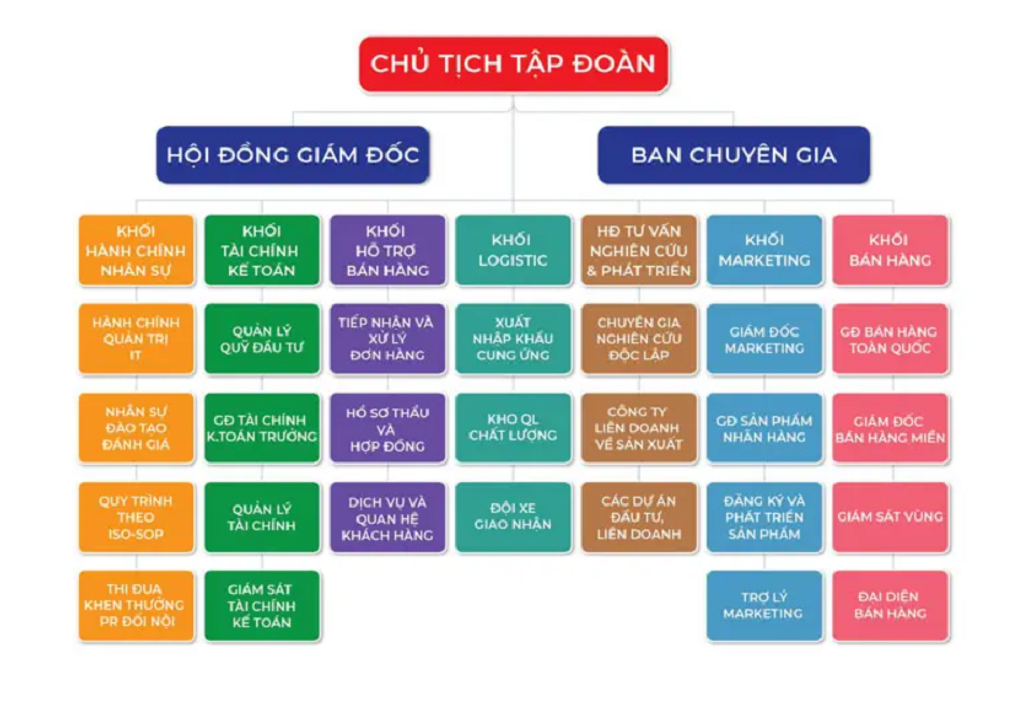
One of the most common examples in businesses is the organizational structure chart. This is a diagram that describes all departments, positions, and levels in a specific order. Below is an illustrative image of a company’s organizational structure chart:

2. The Role of a Business Management Chart
Any business/organization needs to build a business management chart. These charts play an important role in the company’s operations and management, such as:
- Storing employee contact information: All personnel information is stored on a detailed management chart. This allows managers to more conveniently track the information of each individual and department in the organization.
- Displaying the company’s hierarchy and internal structure: With a simple organizational structure chart, anyone can easily understand the company’s hierarchy and internal structure. Additionally, the connections between departments are also clearly shown on the chart.
- Helping employees understand their career development path: The company’s organizational chart helps employees better understand their career development path. This creates motivation and goals for employees. In turn, the business will also achieve its goals and plans.
- Helping employees understand their roles and responsibilities: The company’s organizational chart is also important data that helps each employee clearly understand their role and responsibilities within the organization.
- Overall management of the business/department/team: Metrics and information about the number of personnel, departmental structure, tasks, functions, etc., are all compiled on the organizational chart. Through this, managers can easily manage the entire business/department/team.
>> Read more: 7 effective business management methods – Automated company management
How is a Business Management Chart Built?
A business management chart is a tool that helps clearly define roles, responsibilities, and information flow within an organization. To build an effective chart, a business needs to start by defining its objectives, analyzing functions and tasks, and then designing a model that fits its scale and culture.
Step 1: Determine the Business Structure
The business structure is the result of the company’s efforts to build and divide the organization into corresponding departments with different positions from its inception to carry out business activities.
Depending on the type of business, the organizational structure chart will differ. Therefore, to build a complete business chart, the company must first determine its structure. Common types of businesses today include:
- Single-member limited liability company
- Limited liability company with two or more members
- Joint-stock company
- Partnership
- Sole proprietorship

The overall picture of a business is formed by its individual departments and positions. The business needs to clearly define its structure to have the database for drawing up a business management chart.
Departments will have close links with each other to support business operations. Therefore, the business also needs to clearly define the responsibilities, benefits, and relationships between departments.
Example: ABC Company is a limited liability company with 2 or more members, operating in the field of manufacturing and distributing electronic products.
– The company’s business structure: Members’ Council, Chairman of the Members’ Council, Director.
– Departments at ABC Company: Planning and Strategy Department, R&D (Research and Development) Department, Production Department, Sales Department, Marketing Department, Accounting Department, Human Resources Department, Administration Department.
Step 2: List the positions and job roles within the business
Once the departments in the business have been identified, proceed to list the positions and job roles for each of those departments.
- Define positions and levels: Identify job positions in each department by level, such as department head, director, staff, specialist, etc.
- Job description: Create a detailed description of the job requirements for each position. Include: duties, responsibilities, necessary skills, authority, and working relationships with other positions in the organization.
- Define relationships between positions: Clearly delineate the links between departments and job positions. The business needs to list superior and subordinate positions, who provides support to whom, who participates in joint projects, or who collaborates in decision-making and work execution.
Example: The Sales Department at ABC Company has the following positions and roles:
- Sales Manager: Manages and directs business activities.
- Sales Staff: Seeks and develops new customers, consults on products/services, and achieves sales targets.
- Sales Specialist: Focuses on selling, building relationships with customers, and meeting their needs.
- Customer Care Staff: Takes care of existing customers, resolves issues, and collects customer feedback.
Step 3: Draw the chart
Based on the information compiled and analyzed in the two steps above, proceed to draw the business management chart. The drawing process is as follows:
- Sketch the chart by hand or using software.
- Start drawing from the overall structure down to the details of each department and position for easy visualization.
- Use shapes like rectangles, circles, and arrows to represent content and the relationships between departments.
- Incorporate colors in the chart to make it more dynamic.
*Note: The business management chart needs to be updated regularly to ensure its accuracy and relevance to changes in the organization and business environment.
>> See more: 5 Steps to Standardize Business Management Processes + [Template]
Popular Business Management Chart Templates Today
Currently, depending on their scale and operational characteristics, businesses can choose from various types of management charts. Each model – from linear, functional, and matrix to flat models – has its own advantages and disadvantages, suitable for different stages of development. Understanding popular chart templates will help managers choose the optimal structure that both ensures operational efficiency and creates flexibility in work coordination. Below are 5 popular business management chart templates today
1. Matrix organizational model
The matrix organizational model is a model built on multi-dimensional authority and support. The information in the model is presented by hierarchy and the relationships between related departments, jobs, and projects. All members of the organization can easily grasp information, support, and interact with each other. As a result, work efficiency and quality are also improved.

| Evaluation Criteria | Advantages | Disadvantages |
| Overall work efficiency | – Optimizes human resources | |
| Individual work efficiency | – Develops specialized human resources | – Difficult to evaluate work efficiency – Low self-discipline in work |
| Time | – Quick decision-making | – Time-consuming |
| Flexibility | – Enhances teamwork ability | – Multiple management levels |
| Interaction and communication ability | – Enhances corporate communication | |
| Scientific nature and transparency | – Conflicts of authority and tasks between management departments |
2. Functional organizational structure in a company
A functional organizational structure in a business is a model where the organization is divided based on specialized functions. Each department will be responsible for and undertake its own role within its area of expertise.

| Evaluation Criteria | Advantages | Disadvantages |
| Overall work efficiency | – Improves work quality – Increases performance – Accurate and effective tracking and evaluation |
– Slow work progress – Poor monitoring capabilities |
| Individual work efficiency | – Enhances professional expertise – Specializes the skills of management levels |
|
| Time | – Untimely decision-making | |
| Flexibility | – Prone to conflicts – Misalignment between individual and business goals |
|
| Interaction and communication | – Low connectivity between departments and individuals – Departments work in isolation |
|
| Clarity and transparency | – Clear and easy-to-understand structure – Proper allocation of authority and responsibility for each individual/department |
3. Flat Organizational Structure
A flat organizational structure is a model established without a management hierarchy. This means that all personnel have equal power and decision-making authority in the company’s construction and development activities.

| Evaluation Criteria | Advantages | Disadvantages |
| Overall work efficiency | – Saves operating costs | – Difficulty in supervising personnel
– Creates barriers to development |
| Individual work efficiency | – Enhances personal responsibility | – High work pressure – Power struggles – Employees have low motivation and few opportunities for advancement |
| Time | – Shortens approval time | |
| Flexibility | – Difficult approvals | |
| Interaction and communication ability | – Enhances communication skills | |
| Systematic and transparent | – Easy to lose control |
4. Geographic Organizational Structure
The geographic organizational structure is a model built based on the location of headquarters and departments. This model is only suitable for businesses with multiple branches and offices in different geographical locations.

| Evaluation Criteria | Advantages | Disadvantages |
| Overall work efficiency | – Develops and operates by individual locations – Ensures suitability– Enhances performance and work quality at each location |
– Difficult to monitor and manage |
| Individual work efficiency | – Focuses on specific expertise | |
| Time | – Inconsistent work performance | |
| Flexibility | – Flexible workflow | |
| Interaction and communication ability | – Poor information transmission | |
| Organization and transparency | – Clearly defines authority and functions – Provides an overview of the business structure |
5. Hierarchical Organizational Model
The hierarchical organizational model is a model for organizing work and authority within an organization according to management levels. Upper-level departments delegate tasks to management, who then pass them down to lower levels such as leaders and employees.

| Evaluation Criteria | Advantages | Disadvantages |
| Overall work efficiency | – Optimizes resource utilization | – Inconsistent common goals |
| Individual work efficiency | – Focuses on strong professional development | |
| Time | – Slow decision-making | |
| Flexibility | – No overlapping tasks – Clearly divided tasks |
– Poor coordination |
| Interaction and communication ability | – Hierarchical communication | |
| Systematic and transparent nature | – Clear division of responsibilities and benefits – Transparent development path |
Corporate Governance Chart Templates by Business Type
Businesses can also build a corporate governance chart based on the business type registered at the time of establishment. 1Office will share detailed corporate governance chart templates for each type, complete with images, in the content below. Check them out now!
1. Organizational Structure Chart for an LLC
The organizational structure chart for an LLC (Limited Liability Company) is a diagram that shows the hierarchy and relationships between departments, units, and individuals within the business.
There are two main types of LLCs (Limited Liability Companies):
- Single-member LLC: A company owned by a single individual or organization. The organizational structure of a single-member LLC includes: Company President, Director, or General Director. (According to the 2020 Law on Enterprises)
- LLC with two or more members: A company with at least two members (individuals or organizations) who have contributed capital (from 2 to 50 members). The organizational structure of an LLC with two or more members includes: Members’ Council, Chairman of the Members’ Council, Director, or General Director. (Pursuant to Clause 1, Article 54 of the 2020 Law on Enterprises)

Note: The organizational structure chart for an LLC does not include a General Meeting of Shareholders or a Board of Directors.
2. Organizational Chart for a Joint-Stock Company
The organizational structure chart for a joint-stock company is a diagram showing the company’s shareholding structure, and the division of functions and management among departments and shareholders. The organizational structure of a joint-stock company includes: The General Meeting of Shareholders, the Board of Directors, the Director or General Director of the company, and the Supervisory Board. (According to the 2020 Law on Enterprises)

Note: Only joint-stock companies have a General Meeting of Shareholders and a Board of Directors.
3. Organizational Chart for a Partnership
A partnership is a form of business in which two or more individuals or organizations are co-owners and operate under a common name. The organizational structure chart for a partnership is a diagram that describes how the partnership is established and managed.
The organizational structure of a partnership includes: The Partners’ Council, headed by the Chairman of the Partners’ Council, a Director, or a General Director. (According to the 2020 Law on Enterprises)

Corporate Governance Chart Templates by Department
For governance charts by department, please refer to the templates below. 1Office has compiled 5 detailed templates for various departments within a business.
1. Corporation Chart
A corporation chart is a diagram that describes the structure and relationship between member companies within the entire corporation. A corporation is a form of business organization in which a parent company (or a holding joint-stock company) owns or controls other subsidiary or branch companies.
2. HR Department Organizational Chart
The HR department is responsible for recruiting, training employees, and managing activities related to policies, salaries, and employee benefits. The organizational structure of the HR department can be built differently based on the company’s goals and scale. The divisions within the HR department include:
- Recruitment Division
- Training and Development Division
- Internal Communications Division
- C&B (Compensation & Benefits) Division
- HR Admin (Human Resources Administration) Division

3. Sales Department Chart
To build a sales department organizational chart, businesses need to base it on the specific functions and tasks of each unit. These functions and tasks will depend on the business’s goals and strategies.
Currently, businesses often structure their sales department organizational charts in the following 3 forms:
- Island Model: Divides into small, independent teams by region or customer. For example: The sales department is divided by geographical area, including: Northern Sales and Southern Sales.
- Assembly Line Model: Divides work into sequential steps, similar to a production line. For example: The sales department is divided into: Order Reception, Customer Care, Technical, Production Planning, and Ordering.
- Pod Model: Divides into work groups with different specializations that interact and collaborate. For example: The Sales Department is organized into Online Sales and Direct Sales.

4. Marketing Department Organizational Chart
The marketing department organizational chart defines the positions and relationships within the Marketing department to ensure marketing activities are carried out effectively and in line with the company’s goals. The Marketing department organizational chart includes the following main divisions:
- Marketing Director
- Head of Marketing
- R&D (Research and Development)
- Content Marketing
- Digital Marketing
- Designer (Design)
- PR/ Event (Public Relations/ Events)

5. Accounting Department Chart
For some small businesses, they only need one accountant to handle all tasks related to the company’s cash flow. However, for large enterprises, the accounting department needs to be divided into units such as:
- Chief Accountant
- General Accountant / Deputy Head of Accounting
The general accounting team will include smaller groups for: accounts receivable/payable, tax accounting, payroll accounting, sales accounting, debt accounting, and inventory accounting.

Sample Business Management Organizational Charts by Industry
What do the business management organizational charts for construction, manufacturing, trading, logistics, transportation, and tourism companies look like? The answer will be revealed in the content below.
1. Construction Company Organizational Chart
A construction company’s organizational chart is based on two main factors: the company’s scale, and its core products and services. Two common structures in construction companies are:
- Company with construction operations: The company has the capability to execute construction projects itself. The organizational chart includes departments such as: Project Management, Design, Engineering, Procurement, Quality Management, Human Resources Management, and Financial Management.
- Company without construction operations: The company focuses on other activities such as consulting, supervision, or supplying construction materials. The organizational chart will then consist of departments like Sales, Marketing, Technical Consulting, Contract Management, Project Management, and Financial Management.

2. Manufacturing Company Organizational Structure
For manufacturing companies, the organizational structure is divided into 2 types based on their production and business activities as follows:
- Production – Processing: The company focuses on the production and processing of products based on customer requirements.
- Production – Trading: The manufacturing company focuses on production and also participates in trading, marketing, and sales activities.

3. Organizational chart for a trading company
A trading company is a type of business that primarily operates in the field of buying, selling, and exchanging goods or services with the goal of generating profit. Typically, trading companies purchase goods from manufacturers or suppliers and then resell them to end customers, agents, or retailers.
The organizational chart of a trading company may include departments such as:
- Board of Directors
- Technical System: PR/Communications Department, Website/SEO Department, Project Department
- Business System: Marketing Department, Sales Department, Customer Service Department
- Other Functional Systems: General Accounting Department, Human Resources & Administration Department

4. Organizational chart for a logistics company
A logistics company is a business that specializes in transporting and managing goods from the source of supply to the point of consumption. The positions/departments in a logistics company’s organizational chart may include:
- General Meeting of Shareholders
- Board of Directors
- Supervisory Board
- Board of Management
- Departments: Organization, Labor, and Wages Department; General Administration Department; Finance and Accounting Department; Business Planning Department, etc.

5. Organizational chart for a transportation company
Transportation companies are entities that specialize in providing services to transport goods or people from one place to another using various means of transport. The sample organizational chart for a transportation company below includes the following departments:
- General Meeting of Shareholders
- Supervisory Board
- Board of Directors
- General Director
- Functional Management Unit
- Revenue-generating Professional Unit
- Dependent Accounting Unit

6. Organizational model for a travel company
Refer to the sample business management chart for a travel company in the image below:
The organizational structure of the travel company in the sample above includes:
- Board of Directors
- Vice Directors: Operations Management, HR & Administration Management, Business Management
- Department Heads: Operations Department, Tour Guide Department, Administration Department, Finance & Accounting Department, Sales Department, Marketing Department.
- Staff: Receptionist, Designer, Event Organizer, Technical Staff, Tour Guide, etc.

Common mistakes when designing a business management organizational chart
An organizational chart acts as a “map” guiding a business’s operations. If designed properly, it ensures a transparent flow of information, clear responsibilities, and swift decision-making. However, in practice, many businesses struggle due to the following common mistakes:
1. Blindly copying a model from another business
Some companies choose to adopt the exact organizational chart of a business in the same industry or a major competitor. However, every organization has its own unique characteristics regarding scale, products, culture, and development direction. This “copying” can lead to a rigid structure that is difficult to implement and fails to leverage internal strengths.
Causes
- Believing that “if a model succeeded elsewhere, copying it will be effective.”
- Lack of analysis of specific characteristics: scale, products, culture, employee autonomy.
- Pressure from consulting/benchmarking without adjusting to the company’s reality.
Consequences
- Wasted human resources and costs (hiring for unnecessary positions).
- Delayed decision-making and responsibility conflicts.
- Decreased employee motivation due to ambiguous roles and difficulty in performance evaluation.
To build a suitable organizational chart, businesses can follow a practical, multi-step roadmap. First, analyze strategy and operations: clearly define goals for the next 1–3 years while outlining key workflows like sales – implementation – customer care. The next step is to map the current state, which involves redrawing the existing chart and core processes to identify bottlenecks and role overlaps. From there, the business conducts a gap analysis, comparing current capabilities with the ideal model and eliminating unnecessary layers or departments, retaining only the truly suitable components.
2. Failing to update as the business scales
In the startup phase, a simple chart may be suitable. But as the business grows, staff numbers increase rapidly, and products and services diversify, the old chart becomes inadequate. Without timely adjustments, the obvious consequences are overlapping tasks, unclear reporting lines, and disrupted coordination between departments.
Causes
- Complacency: “the old chart still works.”
- Lack of a periodic organizational review mechanism.
- No department (or practice) for workforce planning.
Consequences
- Delayed decisions, slow scaling, and employee confusion about reporting lines.
- Increased administrative costs and reduced work efficiency.
Businesses should review their structure periodically (at least once a year or when staff grows by >15%) to make timely adjustments. Implement clear workforce planning, forecasting human resource needs for each growth scenario. Simultaneously, streamline roles by merging overlapping functions and apply the RACI model to clarify responsibilities.
You can set up automatic alerts for when a department becomes bloated or overloaded with projects, which would trigger a review meeting. After making changes, communicate and train staff clearly, provide updated reporting charts, and answer any questions. Finally, monitor performance indicators like decision-making time, number of approval steps, or the rate of role overlap to make timely optimizations.
3. Too many layers causing information delays
In a desire for “tight control,” some businesses create too many management layers. While this may seem to enhance efficiency, it actually lengthens approval times and causes delays in work processing. Furthermore, lower-level employees tend to lose initiative, and leadership struggles to get a comprehensive overview when reports must pass through multiple intermediaries.
Causes
- The belief that “more layers mean tighter management.”
- Fear of losing control, leading to the addition of more review levels.
- Lack of empowerment, requiring everything to be escalated to upper management.
Consequences
- Delivery delays and missed market opportunities.
- Reduced employee initiative and creativity.
- High management overhead and overloaded middle managers.
To avoid an overly cumbersome organizational chart, businesses can start by measuring the span of control—the average number of employees reporting to each manager. If this number
For specialized projects, businesses can adopt a matrix or flat structure, giving project leaders temporary decision-making authority to accelerate progress. Finally, it’s necessary to measure effectiveness using KPIs like “time-to-decision” to assess the impact before and after the change.
How does a management structure impact partner and customer relationships?
A business management structure is not just an internal tool for dividing responsibilities; it also directly affects how a company builds and maintains relationships with partners and customers. A clear organizational structure helps a business demonstrate professionalism, build trust, and create a more consistent customer experience.
For business partners:
- Transparent responsibilities: The management structure clearly shows who is in charge of which area, helping partners know exactly who to contact when issues arise. This minimizes overlap and enhances collaboration efficiency.
- Increased trust and professionalism: A business with a clear structure often gives the impression of stability and good management, making partners more willing to sign long-term contracts.
- Accelerated coordination processes: When departments coordinate smoothly, partners also benefit from faster progress, reducing project delays.
For customers:
- Seamless service experience: Customers are not passed back and forth between departments, as the management structure clearly identifies the department responsible for support or problem resolution.
- Increased satisfaction and loyalty: When customers see that a business responds quickly and has smooth workflows, they tend to trust it and remain loyal long-term.
- Crisis management support: In the event of a product or service issue, a clear management structure helps the business react quickly and coordinate effectively to retain customers.
Real-world example: A logistics company implemented a decentralized organizational structure, where each department (logistics, customer care, accounting) has a clear point of contact. As a result, customer complaint resolution time decreased from 5 days to 2 days, and the customer satisfaction rate increased by 30%. This is clear evidence that a scientific management structure can create a real competitive advantage.
A business management structure not only helps optimize internal operations but also serves as a vital bridge to partners and customers. A transparent and flexible structure is the foundation for building credibility, increasing collaboration efficiency, and enhancing the customer experience – thereby promoting the sustainable development of the business.
What are the criteria for evaluating the effectiveness of a management structure?
A business management structure is only truly valuable when it helps the organization operate smoothly, transparently, and achieve high performance. To prevent the structure from being just “on paper,” businesses need to regularly measure and evaluate its effectiveness based on specific criteria.
Clarity and transparency in authority delegation
- Each department and position must have specific roles and responsibilities.
- Avoid overlaps and ambiguity that leave employees wondering “who to report to.”
- Example: If the sales and marketing departments both handle customers without clear boundaries, conflicts and wasted resources can easily occur.
Speed and quality of decision-making
- An effective structure facilitates a rapid approval and implementation process.
- Conversely, if decisions must pass through multiple layers, the business can easily miss market opportunities.
- Example: Tech startups often choose a flat structure to make decisions quickly, shortening the time to launch products.
Effectiveness of inter-departmental coordination
- Evaluated based on the level of collaboration and information sharing.
- A good structure helps departments coordinate smoothly, without creating silos.
- Example: A manufacturing company adopts a matrix model → increasing connectivity between the design, production, and sales departments.
Flexibility and adaptability
- The management structure must be adjustable when the business scales, restructures, or changes its strategy.
- Example: When a traditional trading company adds an eCommerce channel, it must add a Digital department. If the structure doesn’t change, operations will become chaotic.
Employee engagement and satisfaction level
- When the chart is clear, employees understand their roles and career paths correctly → increased engagement.
- Conversely, if the structure is confusing, employees can easily feel overlooked or treated unfairly.
Evaluating the effectiveness of a management chart isn’t just about looking at a beautiful or complex structure. What’s important is whether it helps the business make decisions faster, operate more efficiently, and keep employees, customers, and partners more satisfied. A good chart must be continuously monitored and improved to accompany the company’s growth.
How to effectively manage a business management chart with 1Office software
As you can see, a business management chart plays a crucial role in a company’s operations and management. Not only do they build an overall management chart, but many businesses also create multiple charts for individual departments, individuals, etc.
With a large number of management charts, managing, tracking, creating, and editing them using traditional methods can be very difficult. The process of exchanging and sharing charts is also time-consuming and labor-intensive for the business.
Understanding this, 1Office has developed human resource management software to help businesses BUILD – STORE – SHARE – SECURE their business management charts. This feature has been trusted and applied by many business owners in their operations due to its capabilities:
- Centralized chart storage: All data is centralized on a synchronized management system. This avoids situations where data is stored in multiple different places, making it difficult to search for or even leading to data loss.
- Easy chart creation and editing: Simply by clearly defining the departmental and organizational structure, you can start building the management chart directly on the system. The software also supports users in editing the chart as desired if there are changes in the organizational structure.
- Easy tracking: Members with assigned permissions can easily track the business management chart. The chart displays everything from the overall structure down to the details of each department and individual.
- High security: Businesses can assign access permissions by department or personnel for each chart file/information as needed. Permissions can be set at different levels: view only, edit, comment.
Frequently Asked Questions
Are management charts and organizational charts different?
Yes. An organizational chart primarily shows the departmental structure and hierarchy, while a management chart also emphasizes operational relationships, authority delegation, and how the business actually operates.
Is a flat management chart suitable for all businesses?
No. This model is more suitable for small businesses with lean teams that need to make quick decisions. When the scale is larger, with more departments and management layers, a flat model can be difficult to control.
Who should be responsible for creating and updating the management chart?
Usually, it’s the leadership team in coordination with HR or the human resources administration department. This is because it’s not just a personnel chart, but also relates to authority, operations, and responsibilities between departments.
When the departmental structure changes, does the chart need to be updated immediately?
Yes. When the departmental structure changes, the business should update the chart promptly to avoid discrepancies in authority, reporting, and work coordination between departments.
When should a business use software to manage its management chart?
A business should use software when its structure starts to become more complex, with many departments, branches, or frequent personnel changes. If you want to go beyond the chart to actual operations, you should prioritize a solution that can digitize processes to clearly assign responsible persons, processing flows, and coordination methods between departments. You can refer to the 1Office process management software with AI and No-code integration
Thus, this article has compiled over 20+ sample business management charts as well as effective ways to manage them. Readers should start building the most effective management charts for their businesses right away. Don’t forget to also use 1Office’s document management feature to manage your data and management charts. We wish you success!