The Latest Automatic Gantt Chart Software for 2026 That Businesses Should Know
In the current “Digital Transformation” race, having a tool that helps managers and employees clearly grasp work progress and the completion percentage of tasks is extremely important. Therefore, Gantt chart software is one of the most popular tools today. In this article, we will introduce you to this Gantt chart software, along with its benefits and how to use it.
Mục lục
I. What is a Gantt chart?
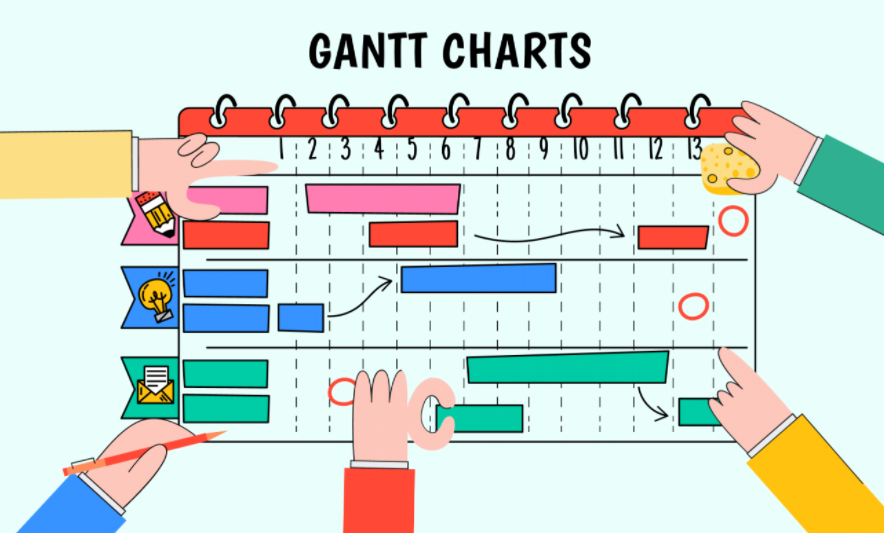
1. Definition
A Gantt chart is a tool that helps organizations/individuals manage, plan, and schedule projects of all sizes. It is a type of horizontal bar chart that visually represents a project plan against a timeline. Gantt charts typically display the progress, status, and the person responsible for each task in the project.
2. 7 Advantages of using Gantt chart software in project management
A Gantt chart is a tool that helps managers and employees manage project progress in the most comprehensive and general way. Some of the highly-rated advantages of using a Gantt chart, according to experts, include:
- Easy planning: When using Gantt charts for project management in a business, they help you easily create complex plans, especially those involving multiple departments and changing deadlines. Gantt charts help teams plan work according to deadlines and allocate resources reasonably.
- Comprehensive project progress monitoring: By using a Gantt chart, managers can grasp issues such as the relationship between the start and end dates of tasks, key milestones, and dependent tasks.
- Avoid resource overload: Gantt charts allow you to use your resources effectively as you can see the progress of a project. When implementing a Gantt chart, you can also delegate tasks and arrange resources without overburdening them.
- Increase proactivity in work: When using a Gantt chart to carry out work, individuals can create their own schedules and be proactive in arranging their tasks, avoiding overlaps between the tasks they need to complete.
- Enhance connectivity among individuals in the same project: Remote work is a very popular form of work today due to its convenience. However, when you manage a project with a remote team, you will face more difficulties in coordinating and keeping everyone on the same page. Therefore, a Gantt chart is an effective solution that helps everyone stay on the same page while making it easier to work together. It allows you to visualize what has been completed, what is in progress, and what lies ahead, helping everyone stay aligned during the project’s development, regardless of their country or time zone.
- Strengthen individual work responsibility: By using a Gantt chart, all tasks are displayed on the chart: tasks completed on time, completed ahead of schedule, unfinished tasks, etc. It gives both managers and team members a fair opportunity to use this solution to highlight how often they exceed expectations and be recognized.
- Promote transparency in project execution: By using Gantt chart software, it will focus on displaying the detailed tasks and key milestones of each team member so that everyone knows about each other’s workload and can help those who may be struggling to complete their tasks. This transparency in the workflow further promotes team spirit, honesty, and humility within the team.
>> [Updated 2026] TOP 10 Best project management software to effectively monitor project progress
II. How to create a Gantt chart for individuals/businesses
Generally, it can be said that Gantt chart software is the use of a Gantt chart to manage a project’s workflow.
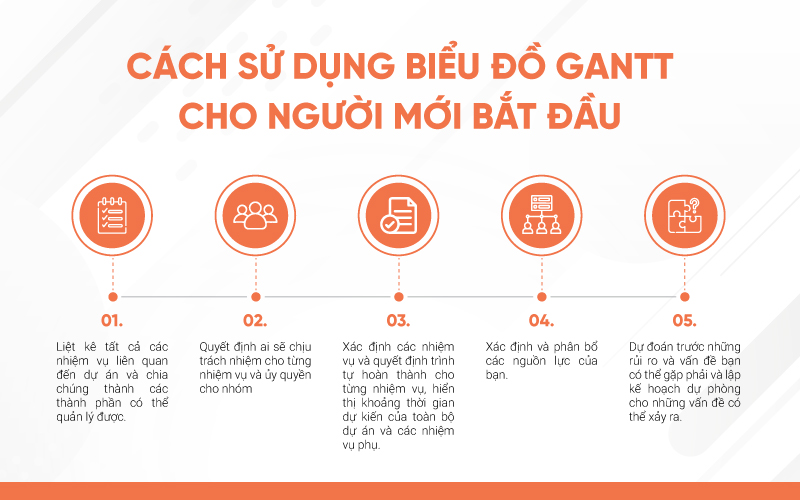
To construct a complete Gantt chart, you need to know all the individual tasks required to complete the project, estimate the time each task will take, and which tasks are dependent on others. The process of compiling this information helps the project manager focus on the essential parts of the project and begin to establish a realistic timeframe for completion.
Project Planning
A Gantt chart displays the project timeline according to planned tasks and their end dates. Typically, a Gantt chart has two views: an overall information view (e.g., summary tasks and overall project progress) and an in-depth view (e.g., the progress of each specific task and the person responsible for it).
A Gantt chart shows the relationship between tasks over time, the project sequence, task dependencies, and key milestones. This feature also helps project members get a clear overview of work completion progress.
Project phase overview
A Gantt chart not only contains information about the entire project lifecycle but also allows you to set up in-depth details about departments, phases, or parts of the project. With a Gantt chart, users can easily manage the entire project as well as each small phase within it, and allocate work reasonably.
Project progress
Gantt charts allow members to easily update their status and complete tasks. This is also an effective way to manage projects because it automatically updates the progress of each person’s sub-tasks on the overall chart screen, helping relevant people stay informed of the latest task statuses.
Applications of Gantt chart software in various fields
1. Gantt charts for construction project management

In reality, construction projects, in particular, can be completed inaccurately and behind schedule. This leads to wasted money and time for investors and project managers. That’s why you should use a Gantt chart to ensure you have documented everything, planned, and executed it in the proper sequence. Additionally, Gantt charts can be used for both small and large projects and are important for anything you want to coordinate.
2. Gantt charts in the sales process
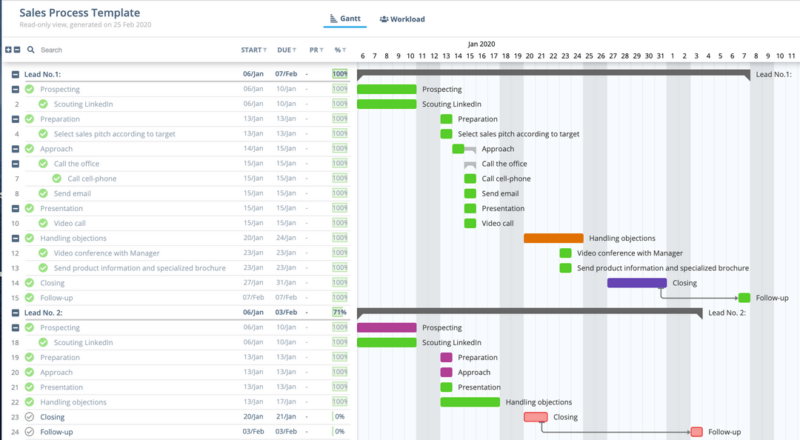
In a product sales project, clearly identifying the actual status of product consumption, encountered issues, and the quantity of products sold helps the organization understand the market situation and devise appropriate solutions to improve the product for the business. Additionally, using a Gantt chart will help employees know which potential customers you still need to contact, who needs a follow-up call, and more.
Gantt chart software will help you track all individual sales, contacts, potential customers, and more.
3. Applying Gantt software to Digital Marketing
Digital marketing is one of the new business industry trends.
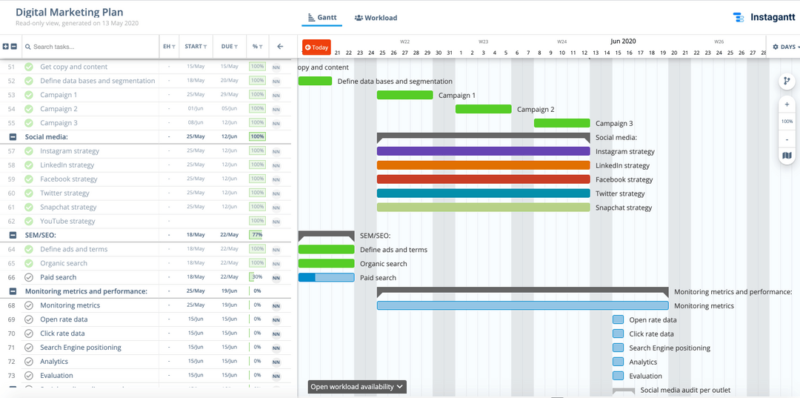
A Gantt chart allows you to create a plan for all your Digital marketing activities. Instead of creating ads as you go or just ‘winging it,’ you’ll be able to truly map out a cohesive strategy that will take you from point A to point B in no time. With a Gantt chart, you won’t have trouble building a specific marketing plan because you can create all the tasks, sub-tasks, etc., that you need. You will also be able to monitor everything happening in your project, including the budget, deadlines, and even who is assigned to different tasks.
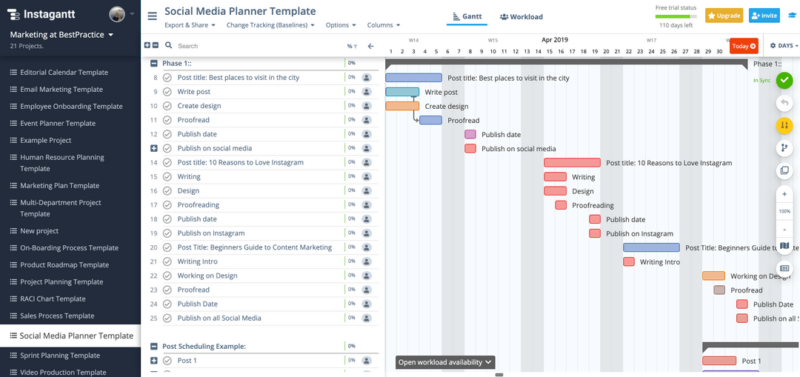
By creating a social media planning tool, you will improve your chances of actually posting whenever you want. Additionally, these charts allow you to set up details about what you want to post so you know when to do it, where to post, who is in charge of the post, and anything else you want. You can also adjust and rearrange your posts and content however you want and whenever you want. All of this will make it easier for you to grasp the goals and plans for your social media pages, whether for personal or professional use.
| Learn more: Gantt Chart and how to apply Gantt in project and task management |
III. Creating a Gantt Chart Manually with Excel
Microsoft Excel has a Bar Chart feature that can be formatted to create a Gantt chart.

- Step 1. List your project schedule in an Excel table.
List each task as a separate row and structure your project plan by including the start date, end date, and duration.
- Step 2. Define the relationships between project tasks
Typically, in a Gantt chart, there are three main relationships between sequential tasks:
Finish to Start (FS) – An FS task cannot begin until the preceding (and related) task is finished.
Start to Start (SS) – An SS task cannot begin until the preceding task has begun.
Finish to Finish (FF) – An FF task cannot finish before the preceding task has finished.
There is also a fourth type, Start to Finish (SF), which is very rare.
- Step 3. Represent the Gantt chart
Typically, the structure of a Gantt chart includes: the duration of tasks to be completed, task descriptions, etc.
- Step 4. Add task descriptions to the Gantt chart.
- Step 5. Convert the bar chart into a Gantt chart in Excel through formatting.
IV. 1Office’s Automatic Gantt Chart Software
There are many Gantt chart software options on the market today. However, having an automatic chart creation tool combined with numerous task management features is the most suitable choice for managers because it provides everything you need to manage the entire project lifecycle.
As one of the leading companies in business management software, 1Office has introduced an automatic Gantt chart creation feature. When using 1Office, you will receive benefits such as:
Project and Task Management
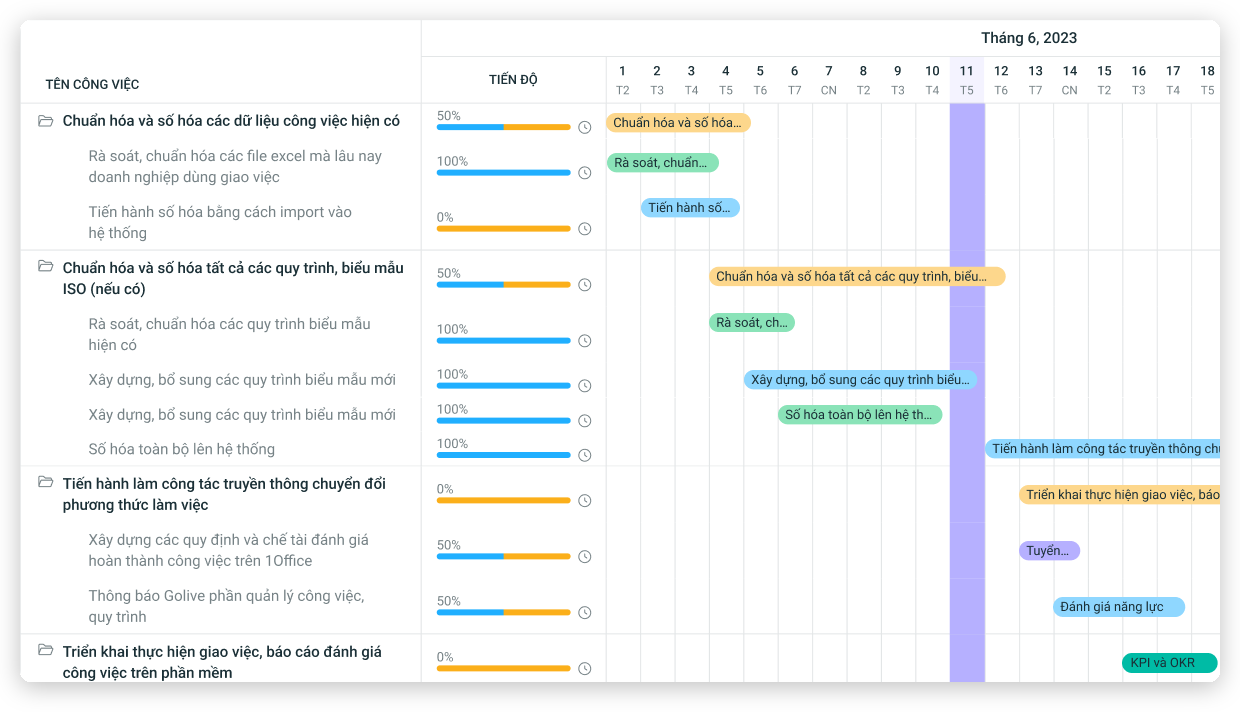
When setting up a project in 1Office, you can add various tasks within that project. As tasks are completed according to the criteria you set, their completion percentage/progress will be displayed on the interface as shown below.
Set Start and End Dates for Tasks
Setting up and tracking the schedule for each task also becomes much easier. The software allows you to assign tasks and set start and end dates, helping managers and employees proactively track whether work is completed on time.
The software will also display “Planned” and “Actual” progress, allowing managers to easily evaluate employee performance (who completes tasks on time, who is behind schedule, the reasons why, etc.) to plan more suitable task assignments for each person.
Add Tasks and Tag Assignees
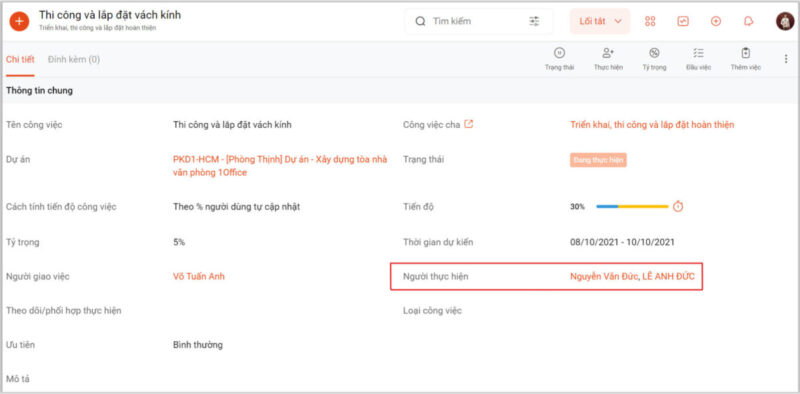
A clear division of responsibilities for each department helps minimize delays or missed assignments.
An extremely useful feature is that the software sends instant notifications to project stakeholders whenever there is a change. In addition, project members can also discuss, interact directly, and attach relevant documents in the project/task discussion section.
The software automatically extracts all project data to display it as a Gantt Chart, as well as in other formats like Kanban, Checklist, etc. Providing a variety of chart types helps managers get a more comprehensive and multi-dimensional view of the entire project’s strengths and weaknesses, and to devise effective improvement plans for the future.
This article has helped readers gain a more specific understanding of Gantt Chart software and its benefits for individuals and businesses. In today’s “digitalization” era, using a Gantt chart can help organizations optimize task management time and enhance managers’ ability to supervise their subordinates.
For more details, please visit:
Fanpage: https://www.facebook.com/1officevn/
Youtube: https://www.youtube.com/channel/UCeTIRNqxaTwk0_kcTw6SxmA