4 best ways to calculate payback period for investors
Calculating the payback period is a crucial method that managers and investors must master if they want to evaluate investment projects wisely. This calculation allows managers to assess and compare investment opportunities and profit potential among various projects to make the most accurate decisions and minimize risks. To help businesses develop effective investment strategies, 1Office provides the formula for calculating the payback period with practical examples in this article.
Mục lục
- 1. What is the payback period? Why is it necessary to calculate it?
- 3. What to Note When Applying the Payback Period Calculation?
- 4. Appraising Investment Projects by Combining the Payback Period with Other Financial Indicators
- 5. Which industries and parties need to calculate the investment payback period?
- 6. Double project efficiency with 1Office software
- 8. Conclusion
1. What is the payback period? Why is it necessary to calculate it?
The Payback Period (PP) is the length of time required to recover the cost of the initial investment in a project. Simply put, it is the time it takes for a project to reach its break-even point. At that point, the net revenue generated from the investment is sufficient to cover the initial expenses.
Essentially, the payback period must be less than
| Year 1 | Year 2 | Year 3 | Year 4 | Year 5 |
| $ 75.000 | $ 140.000 | $ 200.000 | $ 110.000 | $ 60.000 |
Calculate the cumulative cash flow for each year:
- Year 0: – 550,000
- Year 1: – 550,000 + 75,000 = – 475,000
- Year 2: – 475,000 + 140,000 = – 335,000
- Year 3: – 335,000 + $ 200,000 = – 135,000
- Year 4: – 135,000 + 110,000 = – 25,000
- Year 5: – 25,000 + 60,000 = 35,000
In Year 5, the cash flow becomes positive, so this is the project’s payback year. The year before the payback year is Year 4, so we apply the payback period formula as follows
4 + (25,000 / 60,000) = 4.42
Therefore, the project’s payback period is 4.42 years.
Read more: Key Financial Metrics Managers Need to Know [Formulas and Meanings]
2.2. How to Calculate the Discounted Payback Period (DPP)
The discounted payback period is a method for determining the time it takes to recover the entire initial investment, taking into account the present value of cash flows. To calculate the payback period, follow these 2 steps:
Step 1. Discount all expected future cash flows to their present value using the formula:

- k = discount rate %
- n = time period of the cash flow
Step 2. Apply the same investment payback calculation method as the non-discounted payback period on the cash flows that have been discounted to their present value.

Example: An investment project has the following expected cash flow:
| Year 0 | Year 1 | Year 2 | Year 3 | Year 4 |
| -1000 | 500 | 400 | 300 | 100 |
Given that the discount rate is 10%, calculate the project’s payback period.
By discounting the project’s expected cash flow to its present value, we obtain the following table:
| Year 0 | Year 1 | Year 2 | Year 3 | Year 4 |
| -1000 | 454,55 | 330,56 | 225,39 | 68,3 |
By summing the cumulative cash flow for each year, we can determine that the project will break even in the 3rd year. Therefore, year 2 is the year before the payback year, so the payback period for this project will be:
DPP = 2 + 214.89/225.39 = 2.95 years
Thus, the payback period for the project is 2.95 years.
2.3. How to Calculate the Payback Period in Months
For small investment projects with a lifecycle measured in months, the method of calculating the payback period in months will be applied. The metric used in this case is the CAC payback period. Calculating the payback period in months is often used in marketing and business projects to measure marketing effectiveness.
The CAC Payback Period is the time required to recover the cost of acquiring a customer. Investors are often very interested in this fundamental metric because it provides an accurate view of a company’s growth potential.
A business is considered to be performing well if its CAC payback period is between 5 and 12 months. The longer the payback period, the more time it takes to generate profit from a customer.
Formula

Example: If a company spends $200 for each new customer, and they pay $20 each month, the business’s payback period is:
$200 / $20 = 10 months
However, if the customer leaves the service before the tenth month, the profit generated will not be enough to cover the acquisition cost.
| >> Read more: What is Working Capital? Formula and Management Methods |
3. What to Note When Applying the Payback Period Calculation?
When calculating the payback period, businesses should note that this method only focuses on short-term risk and liquidity, ignoring the time value of money and profits after the payback period. Therefore, a standard figure should not be applied to all industries; the specific characteristics of each project must be considered. To make an accurate decision, it is mandatory to combine NPV and IRR indicators simultaneously to overcome weaknesses related to cash flow and gain a comprehensive view of investment efficiency.
3.1. Advantages and Limitations of the Payback Period Calculation
Advantages
- The payback period is very simple to understand and calculate.
- It provides essential information for appraising and selecting good investment projects, maximizing profits for the business.
- It is an effective risk measurement tool, especially suitable for businesses with low investment capital and those operating in volatile environments.
Limitations
- The payback period does not account for other values an investment might bring, such as partner relationships or brand awareness. This can lead to investors overlooking the long-term benefits of an investment because they are too focused on short-term ROI.
- The payback period formula also does not consider other impacts an investment might have. For example, new equipment might require a large amount of power to achieve its payback target.
- Another limitation of the payback period is that it does not account for the time value of money. This is because the same amount of money will be worth more in the future than it is today due to the interest it can generate. This is one reason why a short payback period often makes an investment more attractive.
3.2. Some Notes
- When reviewing and appraising a project, the shorter the payback period, the higher the project’s liquidity and the lower the risk.
- As a rule, the best payback period is the shortest one possible. However, the project’s context should not be ignored to get the most objective view. For example, a road and bridge construction project might have a payback period of decades, while a renovation project might only take 5 years or less to break even.
- To appraise an investment project comprehensively, managers need to combine the payback period assessment with metrics like NPV, IRR, and MIRR to get the most complete picture of the project. These financial indicators will help overcome the limitations of the payback period calculation.
See more: How to Calculate Construction Investment Project Management Cost Norms Accurately and Easily
4. Appraising Investment Projects by Combining the Payback Period with Other Financial Indicators
4.1. Net Present Value (NPV)
Net Present Value (NPV) is the sum of the present values of expected future cash flows at a certain discount rate, minus the project’s initial investment.
Formula

Where:
- CF = cash flow
- t = project period
- k = cost of capital
- I = initial investment cost
NPV is used in capital budgeting and investment planning to analyze the profitability of a prospective investment or project. The NPV indicator represents the value added by an investment, taking into account the time value of money.
4.2. Internal Rate of Return (IRR)
The Internal Rate of Return (IRR) is a metric used in project appraisal to estimate the profitability of potential investments. IRR is the discount rate at which the Net Present Value (NPV) of all cash flows equals zero.
Formula:

- CF = cash flow
- t = project period
- IRR = internal rate of return
- I = initial investment cost
The IRR indicator shows the true profitability of the project, and this indicator only changes when internal factors—that is, cash flows—change.
4.3. Modified Internal Rate of Return (MIRR)
The Modified Internal Rate of Return (MIRR) assumes that positive cash flows generated during the project’s implementation years are reinvested at the company’s cost of capital. In contrast, the traditional Internal Rate of Return (IRR) assumes that cash flows from a project are reinvested at a cost equal to the IRR itself. Therefore, the MIRR indicator more accurately reflects the cost and profitability of a project.
Formula

- CF = cash flow
- MIRR = modified internal rate of return
- k = cost of capital
- n = project implementation year
4.4. ROI (Return on Investment)
ROI is a financial metric used to measure the profitability of an investment relative to its cost. It answers the question: “For every dollar of capital invested, how many dollars of profit are returned?”.
The commonly used formula is:

In this formula:
- Net profit: the amount of money received after deducting all costs such as raw materials, labor, operations, taxes, etc.
- Investment cost: the total initial capital spent to implement the project or purchase assets.
The resulting ROI is expressed as a percentage. If the ROI is 20%, it means that for every 100 million invested, the investor receives 20 million in net profit.
4.5. Payback Period
The payback period indicates how much time a project needs to recover the initial capital from the cash flow it generates. This is a metric that helps businesses assess the safety and risk of an investment.
The basic formula is:
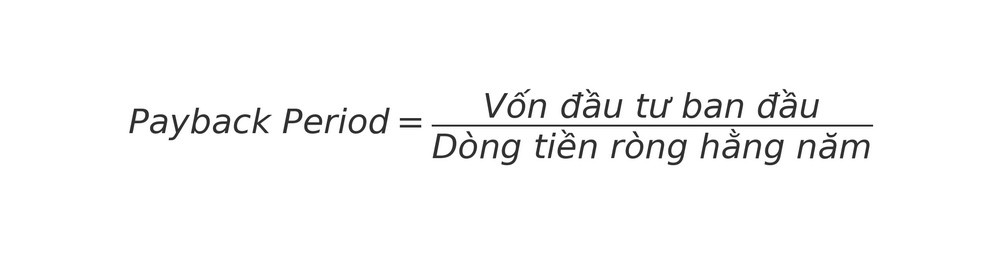
In the formula:
- Initial investment: the total amount of money spent to start the project, purchase equipment, or build facilities.
- Annual net cash flow: the actual amount of money remaining each year after deducting all operating costs.
The result indicates the number of years required to recover the capital. For example, if a project costs 1 billion VND and generates 200 million VND in net cash flow per year, the payback period is 5 years.
4.6. Net Cash Flow
Net cash flow reflects the actual amount of cash remaining during an operating period, usually a month, quarter, or year. This is an important metric to determine whether a business or project is truly creating value.
The simple formula is:

Where:
- Total cash inflow: the total amount of money received during the period, which can come from sales, service fees, debt collection, financial investments, etc.
- Total cash outflow: all expenses during the period, including raw material costs, salaries, loan interest, maintenance, taxes, and other expenses.
If the result is positive, the project is profitable and generates real cash flow; if negative, it means expenses exceed revenues, and the operational feasibility or investment strategy needs to be reviewed.
5. Which industries and parties need to calculate the investment payback period?
Calculating the payback period is necessary for all parties using capital to control risk and optimize cash flow. Whether it’s a large corporation, a startup, or an individual investor, this metric helps assess the ability to recover capital and choose an effective investment plan.
Depending on the industry and role, the application of payback calculation will vary. Specifically:
5.1. Industries that need to use investment payback calculations
Industries that commonly apply payback period calculations include:
- Manufacturing and processing industry: used to calculate the efficiency of purchasing new machinery, production lines, and deciding on factory expansion.
- Construction and real estate: to determine the capital recovery potential of urban area, high-rise, and factory projects.
- Energy and infrastructure: to calculate the capital recovery time for solar power, wind power, bridge, road, and seaport projects.
- Banking and credit institutions: used when appraising loan projects to ensure the borrower’s ability to repay.
- Technology and software industry: applied when investing in ERP, CRM, and IT infrastructure with significant costs.
- Retail and chain services: calculated when opening new stores, supermarkets, or branches to determine the time to profitability.
- Agriculture and food processing: applied for investments in greenhouses, farms, and processing plants to reduce seasonal risks.
The benefits for businesses and investors are evaluating project feasibility, forecasting cash flow, mitigating risks, and making more accurate investment decisions.
5.2. Who needs to use the investment payback calculation
The parties who frequently need to calculate the payback period include:
- Business Owners: need to calculate payback to assess the effectiveness of expanding production, investing in new equipment, or implementing large projects. The benefit is that it helps them know exactly how long it will take to recover their capital, enabling them to decide whether to invest.
- Chief Financial Officers (CFOs): use this metric during project appraisal, cash flow planning, and financial risk control. The payback calculation provides CFOs with a basis for reporting and advising the board of directors.
- Individual Investors: apply it to compare investment opportunities in real estate, stocks, or personal businesses. This calculation gives them a clear view of the level of risk and potential return.
- Banks and Credit Institutions: need the payback metric when appraising loan projects to assess the client’s ability to repay on time. This is one of the key criteria for deciding whether to approve a loan.
- Project Management Teams: use it to plan implementation, balance costs and cash flow, and demonstrate the project’s feasibility to investors or superiors.
- Financial Researchers and Economics Students: learn and study the payback calculation to understand the mechanism of investment decision-making in practice, and apply it in financial model analysis.
For each of these groups, the payback period calculation provides the core value of helping to assess feasibility, control risks, and make more accurate investment decisions.
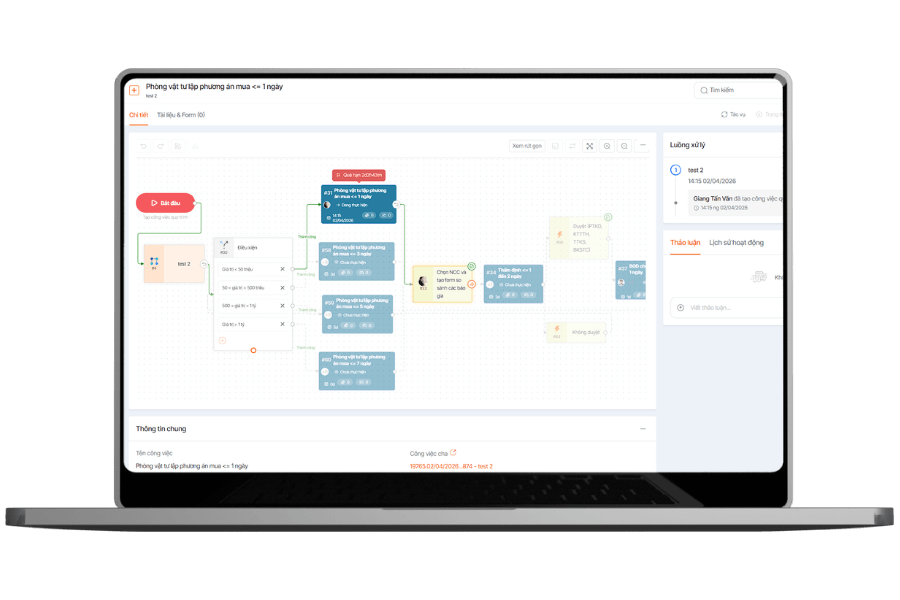
6. Double project efficiency with 1Office software
Choosing the right project is just the beginning; the key factor determining success or failure lies in operational and management capabilities. 1Office is currently the leading comprehensive management platform, integrating breakthrough technologies to help businesses optimize processes, control cash flow, and boost productivity:
-
Digitize processes with the No-code platform: Allows businesses to build and customize applications and workflows that closely follow their actual operational thinking without needing programming knowledge. The intuitive drag-and-drop interface helps shorten implementation time by 80% and flexibly adapts to any project changes.
-
Boost productivity with the 1AI assistant: Integrates an ecosystem of AI Agents to automate repetitive tasks. 1AI can automatically generate meeting minutes, intelligently assign tasks based on personnel capabilities, and provide early warnings for schedule and budget risks, helping managers make more accurate decisions.
-
Multi-dimensional project management: Track details from planning and materials to finances on a single platform. The system provides visual perspectives like Gantt charts, Kanban boards, and real-time data reports, helping to control 100% of the workload and eliminate overlapping or shifting responsibilities.
-
Integrated data for performance evaluation: All work results from the project are directly linked to the KPI and OKR
Businesses can take three approaches: First, optimize the initial investment cost (requiring less capital); second, increase annual net revenue by boosting sales; and third, apply technology like 1Office software to reduce operating costs, thereby increasing net cash flow each period.
8. Conclusion
Through the article above, 1Office has provided you with how to calculate the payback period and a technology solution to help optimize the project management process in your business. For a free consultation and a trial of the 1Office human resource management and payroll software, please contact us using the information below.
For more detailed information, please contact:
- Hotline: 083 483 8888
- 1Office Fanpage: https://www.facebook.com/1officevn
- Youtube Channel: https://www.youtube.com/c/1OfficeNềntảngquảnlýtổngthểDoanhNghiệp