Business Performance Report Template [Word, PDF File] – Free Download 2026
Business Performance Report is a crucial tool that helps businesses accurately evaluate and analyze their business performance to devise optimal development strategies and solutions. However, creating an accurate, comprehensive, and easy-to-understand report is not always simple. In the following article, 1Office will provide you with the latest standard business performance report template, along with detailed instructions on how to create and analyze the report, helping you save time and improve efficiency.
Mục lục
- 1. What is a Business Performance Report?
- 2. Download Free Business Performance Report Templates (Word, PDF)
- 3. Structure of a Business Performance Report
- 4. The Meaning of Indicators in the Income Statement
- 5. Guide to preparing and presenting the business performance report
- 6. Example of a Business Performance Report
- 7. Guide to Reading and Analyzing the Business Performance Report
- 8. How to use the business performance report to control financial costs
- 9. 1CRM – An effective toolset for consolidating and analyzing business performance reports
1. What is a Business Performance Report?
A business performance report is a comprehensive financial document that presents and reflects all indicators of a company’s revenue, costs, profits, and operational efficiency. This report typically includes basic items such as total revenue, cost of goods sold, gross profit, operating expenses, pre-tax income, and net income. The business performance report is an indispensable part of the financial reporting system, helping the business and its stakeholders gain an overview of its financial situation and business operations.

The importance of a business performance report:
- Evaluate business efficiency: The report provides specific data, helping businesses measure operational efficiency, thereby assessing and analyzing strengths and weaknesses in the business process.
- Support strategic decision-making: By analyzing key financial indicators, businesses can identify areas that need investment, resource allocation, improvement, or adjustment to optimize efficiency.
- Enhance transparency: The report serves as a basis for stakeholders, such as investors, banks, or partners, to easily assess the stability and growth potential of the business.
- Analyze trends: By comparing reports from different periods, businesses can identify trends, thereby forecasting and planning for the short and long term.
Thus, the business performance report is not just a financial tool but also a guiding compass, directing the strategy for the sustainable development of the business.
2. Download Free Business Performance Report Templates (Word, PDF)
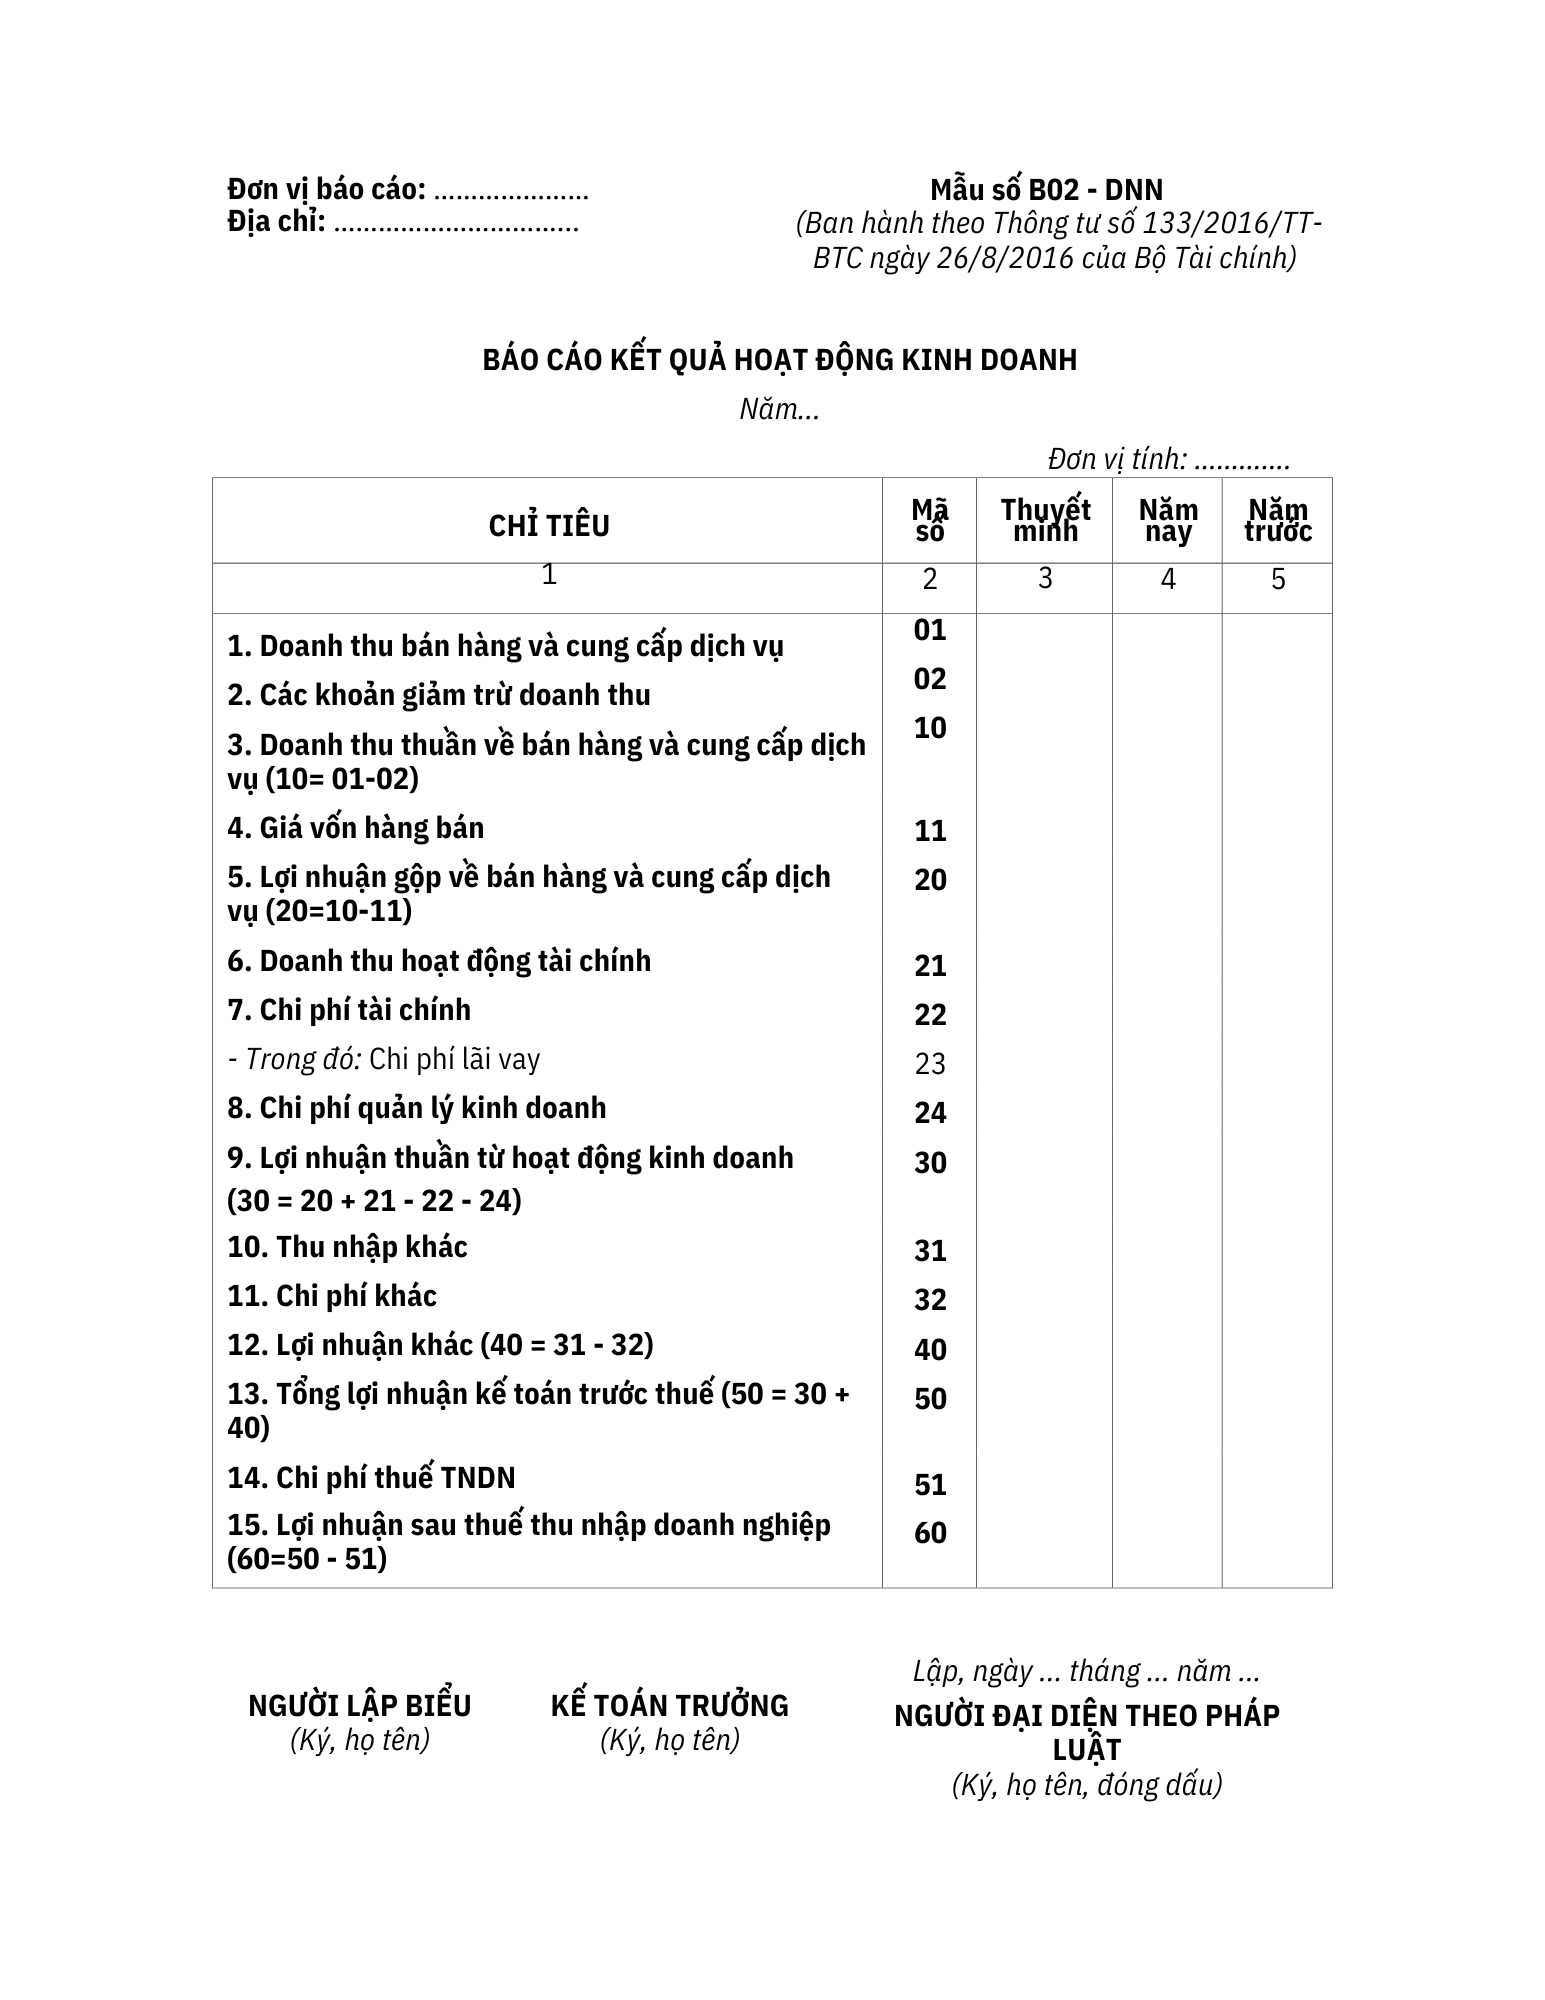
2.1. Business Performance Report Template according to Circular 133
Business Performance Report template according to Circular 133 issued under Circular No. 133/2016/TT-BTC dated August 26, 2016, by the Ministry of Finance).
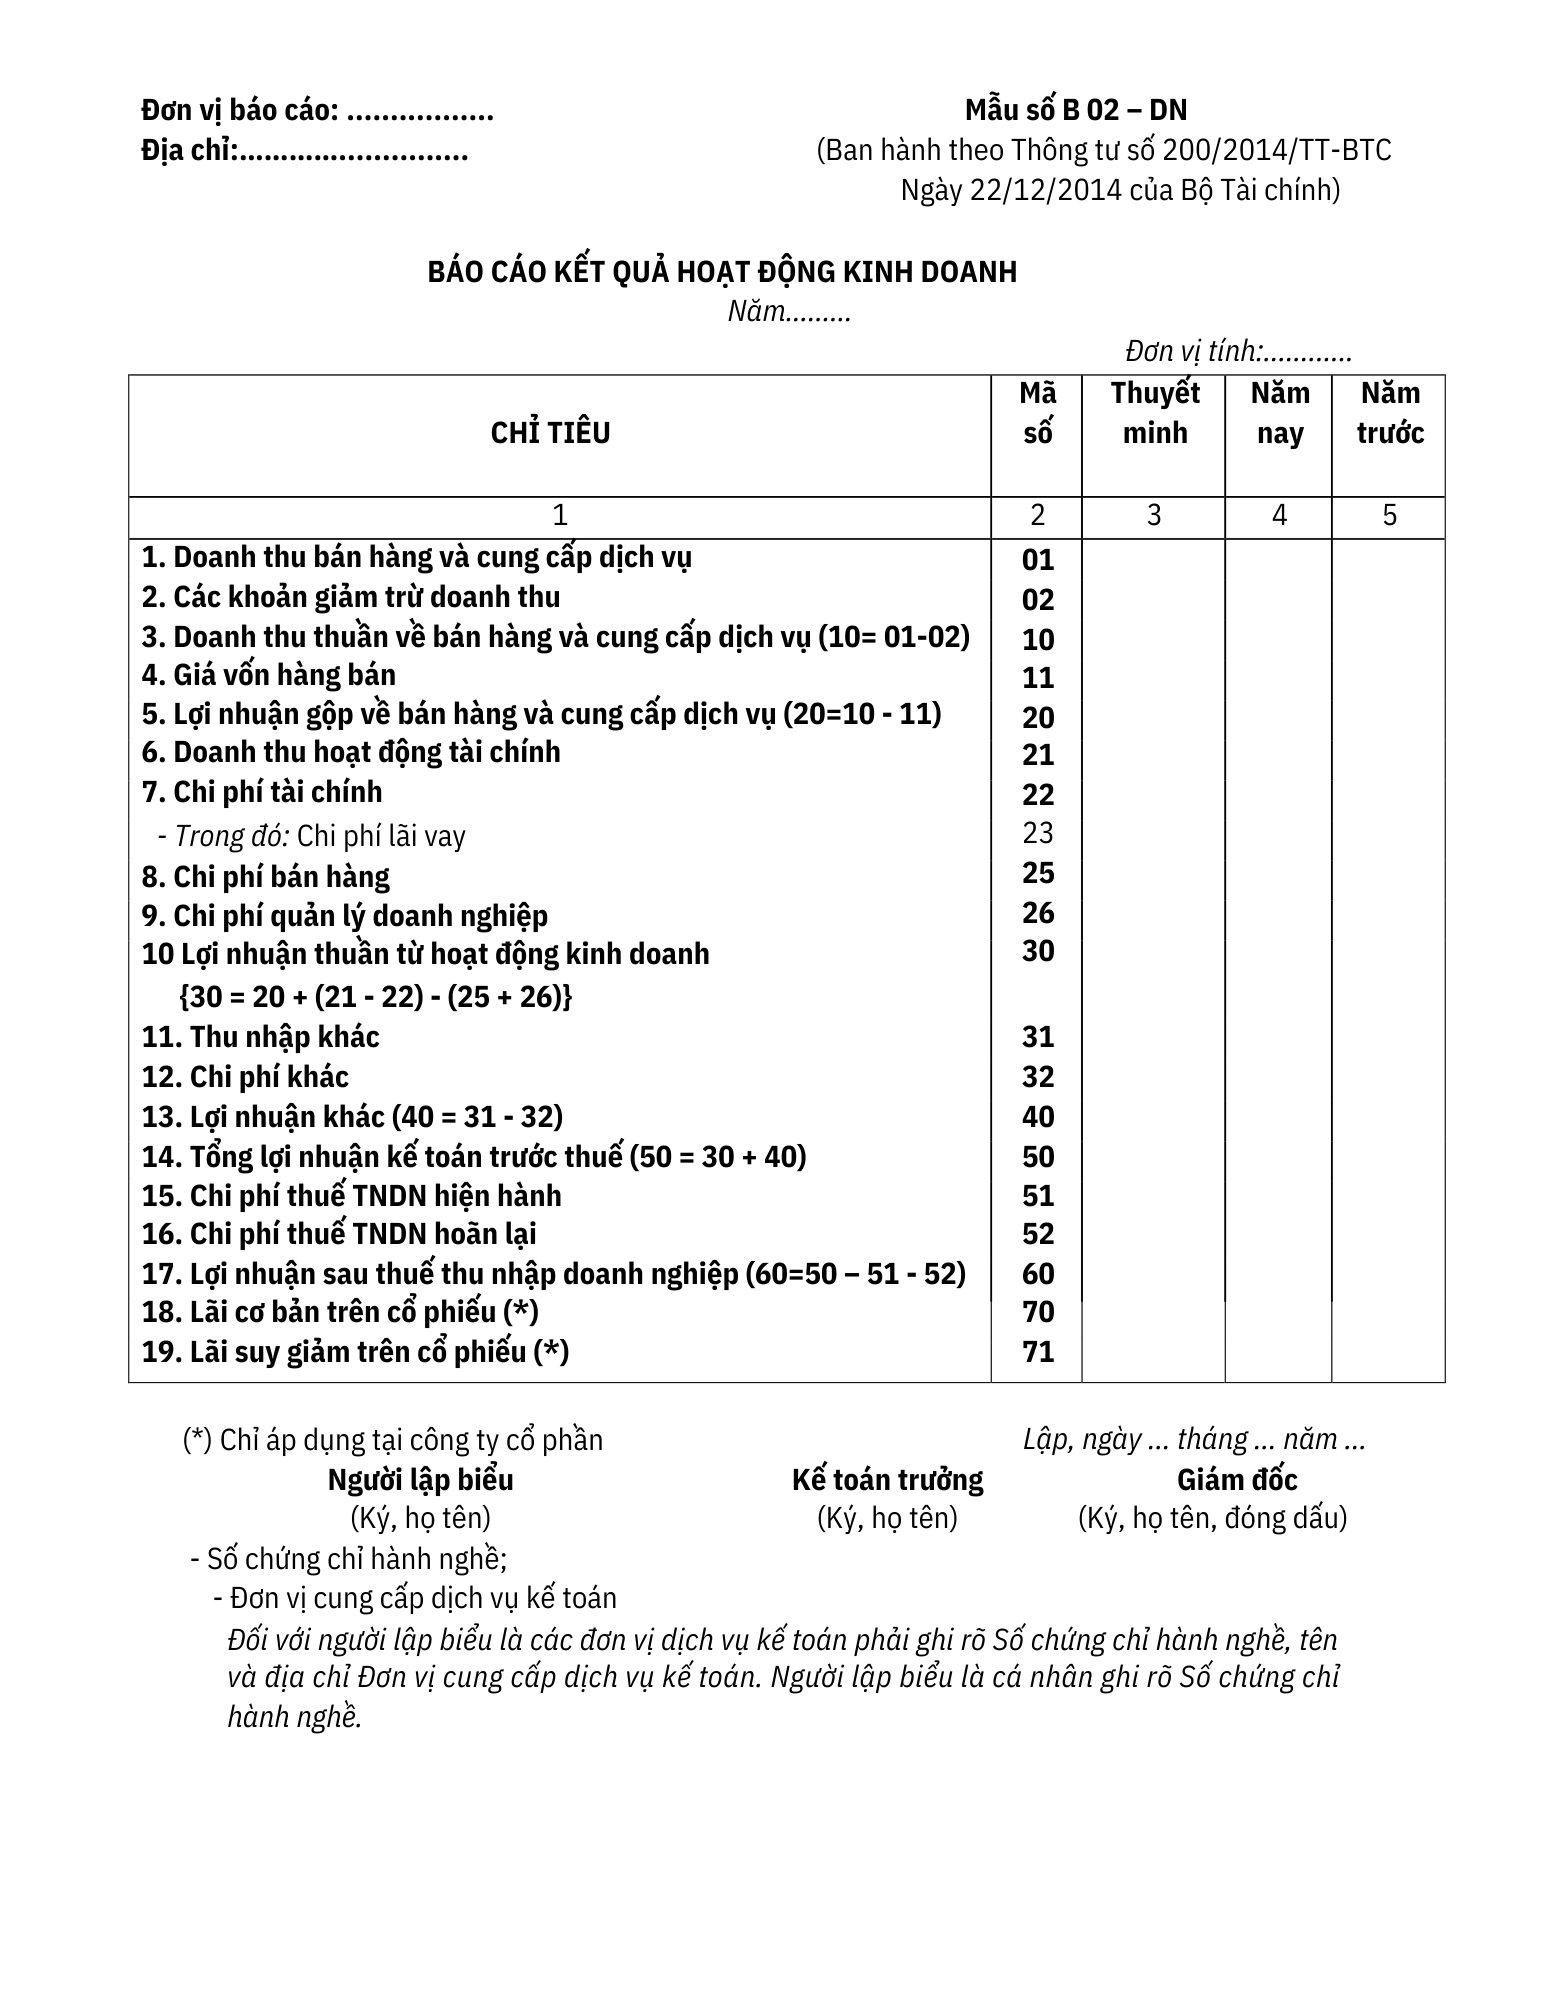
2.2. Business Performance Report Template according to Circular 200
Business Performance Report template according to Circular 200 issued under Circular No. 200/2014/TT-BTC dated December 22, 2014, by the Ministry of Finance.
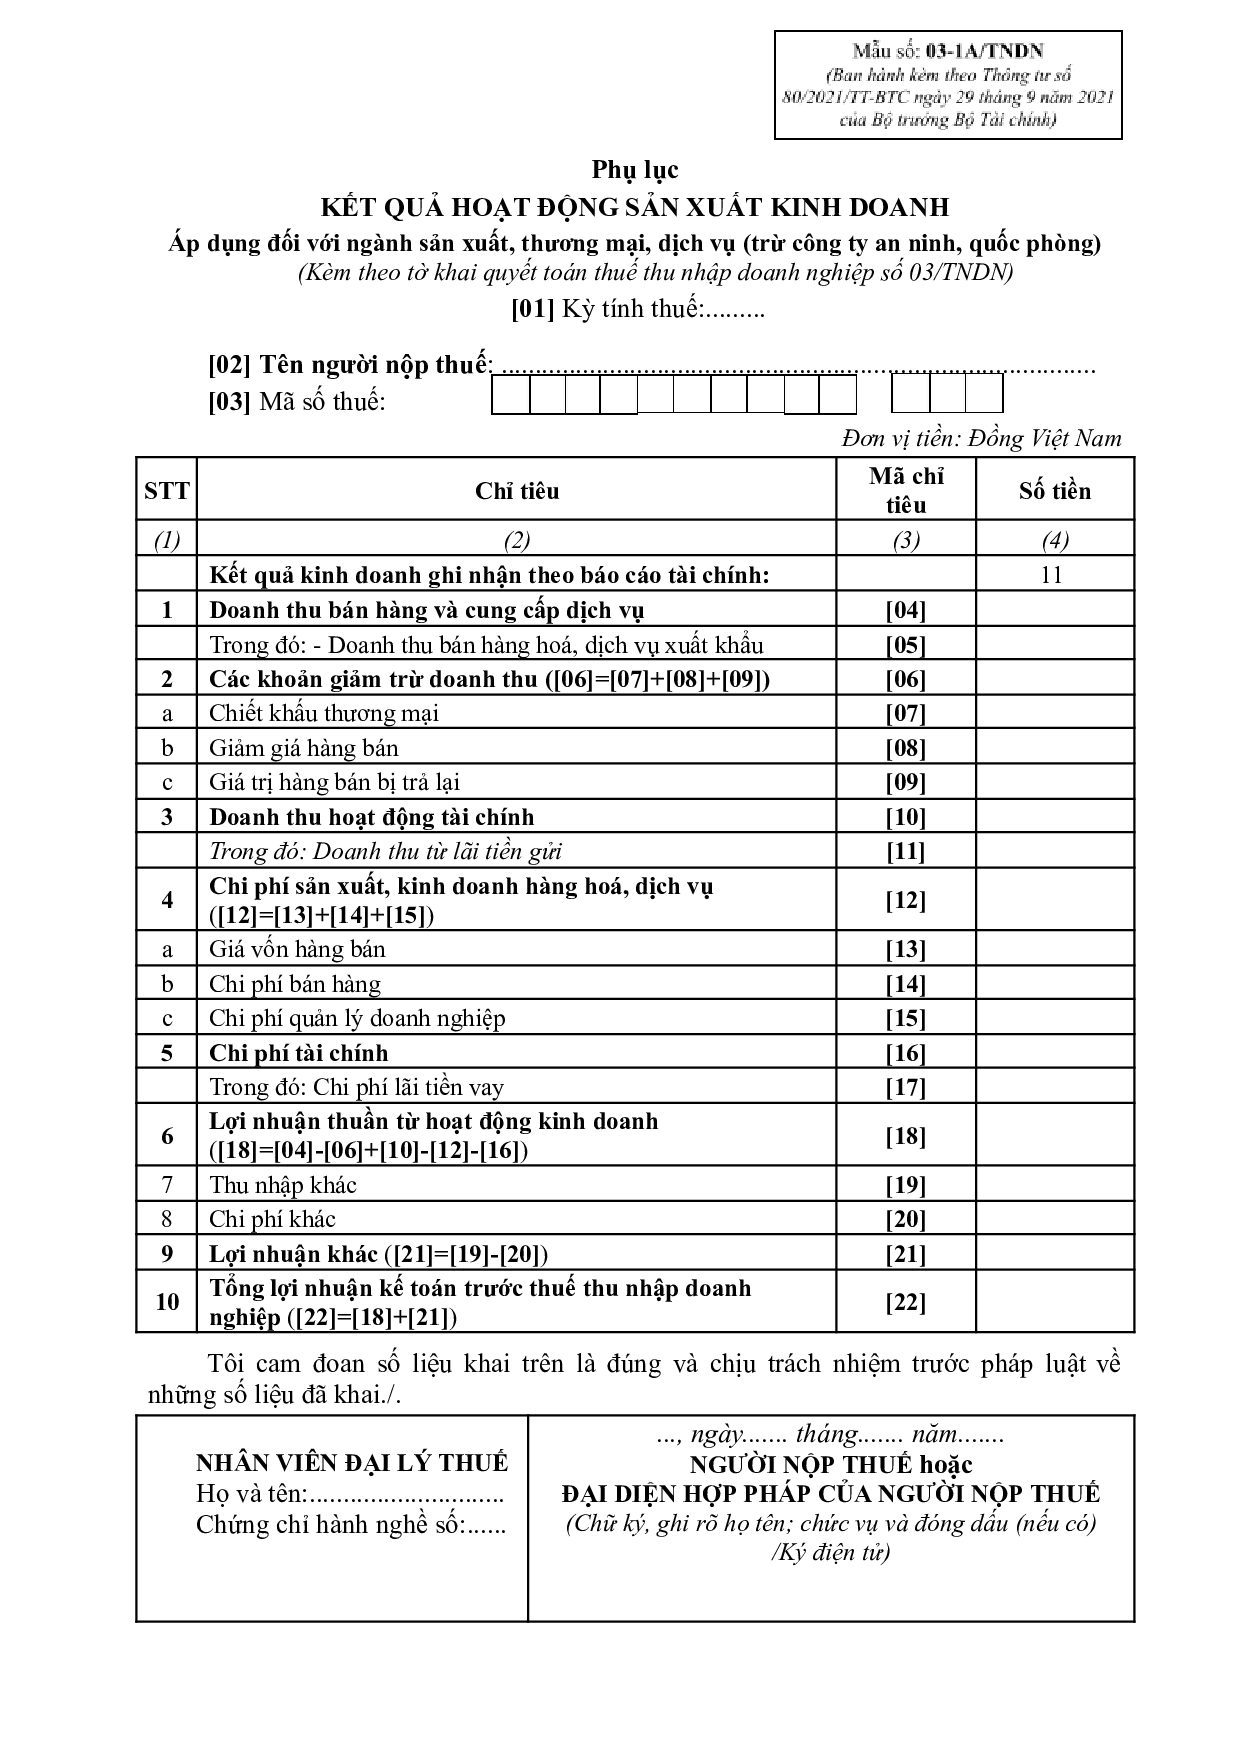
2.3. Appendix Template for Business and Production Results Report:
Appendix template for the Business and Production Results Report according to Circular No. 80/2021/TT-BTC issued on September 29, 2021, by the Minister of Finance
3. Structure of a Business Performance Report
The business performance report is prepared and presented according to accounting principles: the matching principle and the prudence principle. Any revenue, expense, and income items with errors from previous periods must be retrospectively adjusted, rather than being included in the results of the current reporting period. Additionally, items arising from internal transactions between the enterprise and its dependent units (without legal entity status) must be eliminated to ensure accuracy and transparency.
When prepared and presented, the business performance report typically includes the following 5 main columns:
| INDICATOR (1) | CODE (2) | NOTES (3) | CURRENT YEAR (4) | PREVIOUS YEAR (5) |
| – | – | – | – | – |
Column (1) – Item:
- This is a list of important items, showing the main components and key indicators of business operations such as net revenue, cost of goods sold, gross profit, selling expenses, administrative expenses, and profit after tax.
- These items help the report reader analyze and evaluate the effectiveness of business operations comprehensively.
Column (2) – Code
- Each item is assigned a unique code for easy tracking and cross-referencing in reports or accompanying notes.
Column (3) – Notes:
- This column provides detailed and specific explanations for the content of each item, such as calculation methods or related items, to enhance the report’s transparency and comprehensibility.
Column (4) – This Year:
- Includes the actual data for items incurred during the current reporting period. This is crucial data for analyzing business performance in the most recent period.
Column (5) – Previous Year:
- Contains the corresponding figures for the items from the previous year, serving as a basis for comparison for the business to assess growth, trends, or forecast fluctuations in business operations.
4. The Meaning of Indicators in the Income Statement
The income statement provides a comprehensive reflection of a company’s financial situation and operational efficiency during an accounting period. The indicators in the report not only help the company self-assess but also provide important information for stakeholders such as investors, banks, and regulatory agencies.
According to Circular No. 200/2014/TT-BTC, the income statement includes 20 items, divided into two main groups: revenue and expenses. The following is an analysis of the meaning of each group of indicators presented in the report:
4.1. Revenue Indicators Group
This group of indicators focuses on reflecting the total income and revenue-generating efficiency of the business from its primary and secondary business activities:
- (1) Revenue from sales and services: This is the total amount of money a business earns from selling goods, services, and investments. This indicator reflects the scale of the business and its initial revenue-generating capability, but it does not include indirect taxes (like VAT) and other internal amounts.
- (2) Revenue deductions: Includes trade discounts, sales allowances, and sales returns. These are items that reduce actual revenue, reflecting flexibility or issues in the sales process.
- (10) Net revenue from sales and services: This is the actual revenue after subtracting revenue deductions. This indicator shows the basic cost for the business to create products/services, and is the basis for calculating gross profit.
- (11) Cost of goods sold: This is the total direct cost to produce or purchase goods and services. This indicator shows the basic cost for the business to create products/services and is the basis for calculating gross profit.
- (20) Gross profit from sales and services: This is the difference between net revenue and the cost of goods sold. This indicator shows the efficiency of business operations, reflecting the ability to optimize production costs.
- (21) Financial income: This is income from financial activities, such as interest from investments or deposits. This is a supplementary source of income, not directly related to core business operations.
4.2. Expense Indicators Group
This group of indicators reflects the level of expenditure by the business to maintain and develop its business operations.
- (22) Financial expenses: Includes finance-related costs such as royalties, loan interest, and joint venture expenses. This indicator shows the degree of dependence on borrowed capital and related costs.
- (23) Interest expense: This is an expense separated from financial expenses. It is an important indicator for assessing the extent of a company’s use of debt.
- (25) Selling expenses: Includes costs directly related to selling goods and services, such as advertising, shipping, and salaries for sales staff.
- (26) General and administrative expenses: Includes costs to maintain the management and operation of the business, such as salaries, office supplies, and other administrative expenses.
- (30) Profit from business operations: This is the difference between gross profit plus financial income and the related expenses (financial, selling, administrative). This is the most important indicator for evaluating the effectiveness of a company’s business operations.
- (31) Other income: Includes unusual income items such as the sale of assets or reversal of provisions.
- (32) Other expenses: These are unusual expenses incurred during the period, not related to core business operations.
- (40) Other profit: This is the difference between other income and other expenses, reflecting the results from activities outside of core business operations.
- (50) Total accounting profit before tax: This is the total profit from business operations and other activities before calculating income tax. This is a composite indicator reflecting the final financial result before tax.
- (51) Current corporate income tax expense: This is the tax expense payable for the period, based on accounting profit.
- (52) Deferred corporate income tax expense: This is the deferred tax expense arising from temporary differences between accounting and tax.
>>> Read more: What is cost? Classification of costs in a business
4.3. Profit Group
- (60) Profit after corporate income tax: This is the final profit after deducting taxes. It is the most important indicator for assessing the overall financial performance of the business.
- (70) Basic earnings per share (only applicable to joint-stock companies): This shows the profit per basic share, helping shareholders evaluate the return on their investment.
- (71) Diluted earnings per share (only applicable to joint-stock companies): This is the profit per share, taking into account future factors and instruments that may affect the share’s value.
>>> See also: What is profit? Formula and how to calculate profit effectively
5. Guide to preparing and presenting the business performance report
Step 1: Collect information and data
- Gather all necessary figures from accounting books, including accounts related to revenue, expenses, and other items in the reporting period.
- Ensure the accuracy and completeness of the data, including economic transactions that occurred during the period.
Step 2: Compile and calculate the indicators in the report
According to Circular 200/2014/TT-BTC, the indicators in the Business Performance Report are divided into groups: Revenue, Expenses, and Profit.
Below is a summary table of indicators with their codes, content, calculation formulas, and data sources.
| Item | Code | Description | Formula | Data Basis |
| Revenue from sales and services | 01 | Total revenue from the sale of goods and provision of services, excluding VAT under the direct method, special consumption tax, export tax, and other indirect taxes. | Total Credit incurred on Account 511 | Cumulative Credit incurred on Account 511 corresponding to Debits on Accounts 111, 112, 131,… |
| Revenue deductions | 02 | Total revenue deductions: trade discounts, sales allowances, and sales returns, excluding indirect taxes. | Total Debit incurred on Account 511 | Cumulative Debit incurred on Account 511 corresponding to Credit on Account 521 |
| Net revenue from sales and services | 10 | Total sales revenue after deducting revenue deductions. | Code 10 = Code 01 – Code 02 | Total value of period-end transfer: Debit on Account 511 with corresponding Credit on Account 911 |
| Cost of goods sold | 11 | Total cost of goods and services sold during the reporting period. | Total Debit incurred on Account 632 | Total value of period-end transfer: Debit on Account 911 with corresponding Credit on Account 632 |
| Gross profit from sales and services | 20 | The difference between net revenue and cost of goods sold. | Code 20 = Code 10 – Code 11 | |
| Financial income | 21 | |||
| Other income | 31 | Income from non-business activities, such as gains from the liquidation of fixed assets, and recovered bad debts. | Total credit incurred in Account 711 | |
| Other expenses | 32 | Total expenses not directly related to production and business activities during the period. | Total debit incurred in Account 811 | Total value transferred from Debit Account 911 to Credit Account 811 at the end of the period |
| Other profit | 40 | The difference between other income and other expenses. | Code 40 = Code 31 – Code 32 | |
| Total accounting profit before tax | 50 | Profit from business activities and other profit before deducting corporate income tax. | Code 50 = Code 30 + Code 40 | |
| Corporate income tax expense | 51 | Corporate income tax expense incurred during the period. | Debit Account 8211 | |
| Profit after corporate income tax | 60 | The remaining profit after deducting corporate income tax expense. | Code 60 = Code 50 – Code 51 | |
| Basic earnings per share | 70 | Represents the profit per basic share, helping shareholders assess the return on their investment. | Code 70 = (Profit or loss attributable to ordinary shareholders – Amount allocated to bonus and welfare funds)/Weighted average number of ordinary shares outstanding during the period | |
| Diluted earnings per share | 71 | The remaining profit after deducting corporate income tax expense. | Code 71 = (Profit or loss attributable to ordinary shareholders – Amount allocated to bonus and welfare funds)/(Weighted average number of ordinary shares outstanding during the period + Number of ordinary shares expected to be issued)
Profit or loss attributable to ordinary shares = Profit or loss after corporate income tax – Downward adjustments + Upward adjustments |
Note:
- Codes and calculation formulas may vary depending on the type and industry of the business.
- The database is compiled from ledgers, journals, and related accounts.
- End-of-period figures must be checked and reconciled to ensure accuracy.
6. Example of a Business Performance Report
| ITEMS | CODE | NOTES | CURRENT PERIOD | PREVIOUS PERIOD |
| 1. Revenue from sales and services | 01 | 5,000,000,000 | 4,800,000,000 | |
| 2. Revenue deductions | 02 | 200,000,000 | 150,000,000 | |
| 3. Net revenue from sales and services (10 = 01 – 02) | 10 | 4,800,000,000 | 4,650,000,000 | |
| 4. Cost of goods sold | 11 | 3,000,000,000 | 2,900,000,000 | |
| 5. Gross profit from sales and services (20 = 10 – 11) | 20 | 1,800,000,000 | 1,750,000,000 | |
| 6. Financial income | 21 | 300,000,000 | 280,000,000 | |
| 7. Financial expenses | 22 | 150,000,000 | 140,000,000 | |
| Of which: Interest expense | 23 | 50,000,000 | 60,000,000 | |
| 8. Business management expenses | 24 | 800,000,000 | 700,000,000 | |
| Of which: Selling expenses | 25 | 500,000,000 | 400,000,000 | |
| General and administrative expenses | 26 | 300,000,000 | 300,000,000 | |
| 9. Net profit from business operations (30 = 20 + 21 – 22 – 24) | 30 | 1,150,000,000 | 1,190,000,000 | |
| 10. Other income | 31 | 100,000,000 | 50,000,000 | |
| 11. Other expenses | 32 | 30,000,000 | 20,000,000 | |
| 12. Other profit (40 = 31 – 32) | 40 | 70,000,000 | 30,000,000 | |
| 13. Total accounting profit before tax (50 = 30 + 40) | 50 | 1,220,000,000 | 1,220,000,000 | |
| 14. Current corporate income tax expense | 51 | 300,000,000 | 280,000,000 | |
| 15. Deferred corporate income tax expense | 52 | 20,000,000 | 15,000,000 | |
| 16. Profit after corporate income tax (60 = 50 – 51 – 52) | 60 | 900,000,000 | 925,000,000 |
Note:
- Code: The codes are predefined according to Circular 200/2014/TT-BTC.
- Notes: This column provides additional details and explanations for each item, if necessary.
- This Period/Previous Period: Provides data for the current and previous periods for easy performance comparison.
7. Guide to Reading and Analyzing the Business Performance Report
To read and analyze the business performance report, here are some steps that businesses can apply:
Step 1: Read and understand the indicators in the report
When receiving the Business Performance Report, managers need to pay special attention to important indicators to evaluate the company’s operational efficiency. First, examine the Profit after corporate income tax (Code 60) indicator to determine whether the business made a profit or incurred a loss during the reporting period. This is the most crucial figure for assessing the overall final result of business activities, reflecting the level of efficiency after all taxes and expenses have been deducted.
Next, you need to check the Current corporate income tax expense (Code 51) indicator to understand the amount of tax the business must pay during the period. This indicator provides information about the company’s tax obligations, which is particularly important when analyzing the year-end report. Fluctuations in this tax expense may arise from changes in taxable income or tax rates, so it needs to be carefully reviewed to ensure validity and compliance with legal regulations.
Additionally, analyzing revenue and expense indicators is an essential step to evaluate the effectiveness of each specific activity. Analysts should pay attention to net revenue, cost of goods sold, and operating expenses such as selling, general & administrative, and financial expenses. In particular, calculating the gross profit margin will help determine the profit the business earns from each dollar of revenue, thereby assessing the efficiency of resource use and allocation.
Finally, you need to carefully check the reporting period to ensure the data accurately reflects the period being analyzed. Discrepancies in the reporting period can lead to incorrect conclusions, affecting planning and decision-making.
Thus, analyzing the business performance report is not just about reading the numbers; it also requires managers to make evaluations, comparisons, and place them in the context of the company’s actual operations to devise appropriate solutions.
Step 2: Evaluate the indicators in the report in detail
Managers need to analyze the indicators to clearly understand the business performance results, which consist of three main parts: results from core business activities, results from financial activities, and results from other activities.
The results of core business activities are calculated using the formula:
Business Performance Results = Revenue – Expenses
For example:
– Determine the business results from core production and business activities:
| No. | Item | Code | This year (2024) | Previous year (2023) |
| 1 | Revenue from sales and services | 01 | 1,300,000,000 | 1,000,000,000 |
| 2 | Revenue deductions | 02 | 0 | 0 |
| 3 | Net revenue from sales and services (10 = 01 – 02) | 10 | 1,300,000,000 | 1,000,000,000 |
| 4 | Cost of goods sold | 11 | 700,000,000 | 400,000,000 |
| 5 | Gross profit from sales and services (20 = 10 – 11) | 20 | 600,000,000 | 600,000,000 |
| 6 | Selling expenses | 25 | 130,000,000 | 120,000,000 |
| 7 | General and administrative expenses | 26 | 213,000,000 | 200,000,000 |
| 8 | Net profit from core business activities [30a = 20 – (25 + 26)] | 30a | 257,000,000 | 280,000,000 |
Overall assessment: The business performance results for 2024 show that the company achieved a profit of 257,000,000 VND, down 8.2% compared to 2023’s profit of 280,000,000 VND.
To explain this decline, the analyst needs to evaluate in detail the structure, proportion, and fluctuation of revenue and expense indicators. This analysis helps managers clarify the factors that caused revenue to increase while the increase in costs was higher, leading to a decline in overall business results.
Note: The indicator Net profit from business operations (Code 30) includes profit from both main business operations and financial activities. Therefore, in this case, it is necessary to separate indicator 30 into two specific parts for detailed analysis.
- Indicator 30a: Net profit from main business operations.
- Indicator 30b: Net profit from financial activities.
– Reading the business results from financial activities:
| NO. | ITEM | CODE | THIS YEAR(2024) | LAST YEAR(2023) |
| 1 | Financial income | 21 | 5,000,000 | 6,000,000 |
| 2 | Financial expenses | 22 | 20,000,000 | 30,000,000 |
| 3 | Net profit from financial activities (30a = 21 -22) | 30b | -15,000,000 | -24,000,000 |
Overall assessment: The 2024 financial performance report shows the business recorded a loss of 15,000,000 VND, a 37.5% decrease from the 24,000,000 VND loss in 2023. This improvement is mainly due to a reduction in financial costs; specifically, 2024 saw a decrease of 10,000,000 VND compared to 2023.
For micro, small, and medium-sized businesses, which typically do not have large investment activities, financial income is largely derived from interest on savings deposits, checking accounts, or loans to individuals and organizations. Similarly, financial expenses usually include loan interest and foreign exchange losses.
– Interpreting results from other activities:
| No. | ITEM | CODE | THIS YEAR(2024) | PREVIOUS YEAR(2023) |
| 1 | Other income | 31 | 0 | 300.000.000 |
| 2 | Other expenses | 32 | 0 | 150.000.000 |
| 3 | Other profit (40 = 31 – 32) | 40 | 0 | 150.000.000 |
Overall assessment: Business operations in 2024 generated no other income, while 2023 recorded a profit of 150,000,000 VND.
– Review the company’s overall business performance results
| No. | METRIC | CODE | THIS YEAR (2024) | PREVIOUS YEAR (2023) |
| 1 | Net profit from core business activities | 30a | 257,000,000 | 280,000,000 |
| 2 | Net profit from financial activities | 30b | -15,000,000 | -24,000,000 |
| 3 | Other net profit | 40 | 0 | 150,000,000 |
| 4 | Total accounting profit before tax (50 = 30a + 30b + 40) | 50 | 242,000,000 | 406,000,000 |
General assessment: The 2024 business performance report records a profit of 242,000,000 VND from three main activities, a 40% decrease compared to the 406,000,000 VND profit in 2023.
For small businesses, net profit from financial and other activities usually does not account for a significant proportion. Conversely, in medium and large enterprises, these profits can constitute a significant portion of the total business results.
In this case, managers need to determine the proportion of each component constituting the profit and conduct a detailed analysis to evaluate the effectiveness of each activity. Profit from business operations is generally considered more stable and reliable.
If the total profit meets or exceeds the plan but largely comes from financial investment activities or activities outside the core business area, this is a signal that requires the business to conduct a thorough review to devise more suitable and sustainable solutions.
Step 3: Detailed analysis of the business performance report
After identifying the figures and conducting a preliminary assessment of the results of each activity, managers need to delve deeper into the analysis by combining the business performance report with summary tables analyzing revenue, costs, and other supporting reports.
During the analysis process, managers should focus on the following important aspects:
- Revenue: Evaluate each revenue source, identify factors that drive or hinder revenue growth, and analyze fluctuations between reporting periods.
- Costs: Analyze each type of operating cost in detail, determine the cost-to-revenue ratio, and identify inefficient expenditures to implement optimal interventions.
- Operational efficiency: Compare actual results with the set plan to assess the degree of goal achievement, thereby identifying strengths and weaknesses in management.
- Changes over time: Compare data between years or periods to identify development trends, and detect unusual signs or new growth opportunities.
By reviewing, analyzing data, and conducting a preliminary assessment of the results of each activity, managers can gain a more comprehensive view of the actual business situation. This helps the business identify problems, potential risks, and creates a basis for making accurate and timely management decisions to improve operational efficiency, thereby optimizing resources and achieving the set business goals.
8. How to use the business performance report to control financial costs
In manufacturing, construction, or real estate businesses, financial costs – especially interest expenses – are always a decisive factor in profitability. The business performance report not only provides a summary figure but also serves as a management tool that helps leaders monitor financial health and make timely decisions.
How to use in management: Managers take data from code 22 – Financial expenses and code 23 – Interest expenses, then compare it with gross profit (20) and net profit from operating activities (30). The financial expenses/revenue ratio or interest expenses/gross profit ratio will immediately reflect the level of dependence on borrowed capital. If this ratio exceeds the industry standard, it is a signal to reconsider the capital structure.
Management example: A manufacturing company has a net revenue in Q2 of 50 billion VND, with a gross profit of 15 billion. However, interest expenses amounted to 6 billion, equivalent to 40% of the gross profit. After analyzing the report, the CFO proposed converting a portion of the short-term loan to a medium-term loan with a lower interest rate. As a result, in Q3, interest expenses decreased to 4 billion, with the ratio dropping to just 26% of gross profit – helping the company maintain a safe profit margin.
Application timing: This report is usually reviewed monthly to track fluctuations in interest expenses, and it is especially important at the end of a quarter or year when the business needs to present figures to the Board of Directors, banks, or investors.
With this approach, the business performance report is not just a record of figures but becomes a cost control tool. With the support of management software, interest expense data is updated in real-time, helping leaders make faster and more accurate decisions.
9. 1CRM – An effective toolset for consolidating and analyzing business performance reports
1CRM is a superior toolset that helps businesses effectively manage all business operations and cash flow. The software allows for detailed tracking of every transaction, from customer contracts and internal activities to departments and personnel. The system automatically updates monthly revenue and expenditure reports, providing a comprehensive and detailed view of the company’s financial performance.
Key financial and business management features of 1CRM:
-
Track real-time cash flow from multiple account types (bank, cash book, payroll, etc.)
-
Manage cash books, receipts, payment vouchers, and money transfer slips
-
Automatic alerts for upcoming payments or debt collection
-
Digitize all debt information from quotes, orders, and contracts
-
Comprehensive security for financial, order, and contract data
With its ability to automatically aggregate, analyze, and alert, 1CRM not only helps managers closely monitor every transaction but also supports the creation of realistic financial plans, ensuring transparency and proactivity in business operations.
Sign up for a free feature demo!