Top 10 easy-to-use flowchart software 2026
Flowchart software helps businesses visualize workflows, route tasks, and track operational steps more clearly. Instead of drawing by hand or describing disjointed processes, online tools make it easy for teams to design, share, and update diagrams when processes change. The article below compiles 10 easy-to-use flowchart software options suitable for businesses looking to standardize their operations.
>> See more:
- Review of the TOP 10 Best Business Process Management Software
- TOP 10 Project Management Software for Effective Project Planning and Progress Monitoring
Mục lục
- 1. How to Draw the Most Accurate Operational Process Flowchart for Your Business
- 2. TOP 10 Best Online Workflow Diagram Software in 2026
- 2.1. 1Office Business Process Management Software
- 2.2. Org Charting Business Diagram Tool
- 2.3. Edraw Org Chart Workflow Drawing Software
- 2.4. Draw.io Diagramming Software
- 2.5. LucidChart Diagramming Software
- 2.6. Pencil Project Process Diagram Software
- 2.7. RFFlow Process Drawing Tool
- 2.8. ThinkComposer Mind Mapping Tool
- 2.9. Simple Diagramming Tool: Diagram Designer
- 2.10. Graphviz Online Diagramming Software
- 3. What are the benefits of diagramming software?
- 4. Frequently Asked Questions
- 5. Conclusion
1. How to Draw the Most Accurate Operational Process Flowchart for Your Business
Step 1: Define the Process
Identify the main objective and specific steps in the process to clearly understand the activities, their sequence, and the ultimate purpose of the diagram.
Step 2: Gather Information
Collect process-related information from various sources, such as meetings with team members, and by reviewing existing documents and procedures.
Step 3: Build the Diagram
Select and use online diagramming software that suits your business’s needs to create the process flowchart. Some diagramming applications include workflow diagrams, process diagrams, or others depending on your business’s process type.
Step 4: Add Detailed Information
Add information such as step names, responsible individuals, execution times, and any other relevant details the business wants to display on the diagram. You can also use icons, images, and links to visualize the diagram and make it easier to understand.
Step 5: Review and Improve
To ensure accuracy and completeness, discuss and gather feedback from those involved in the process. Then, adjust and refine the diagram so it accurately reflects the business’s operational process.
Note that creating a process flowchart is a continuous process. As the business changes and evolves, the diagram also needs to be updated and adjusted to ensure its effectiveness and accuracy.
| >> Read more: What is a Flowchart? Tools and Tips for Drawing the Most Accurate Flowcharts for Businesses |
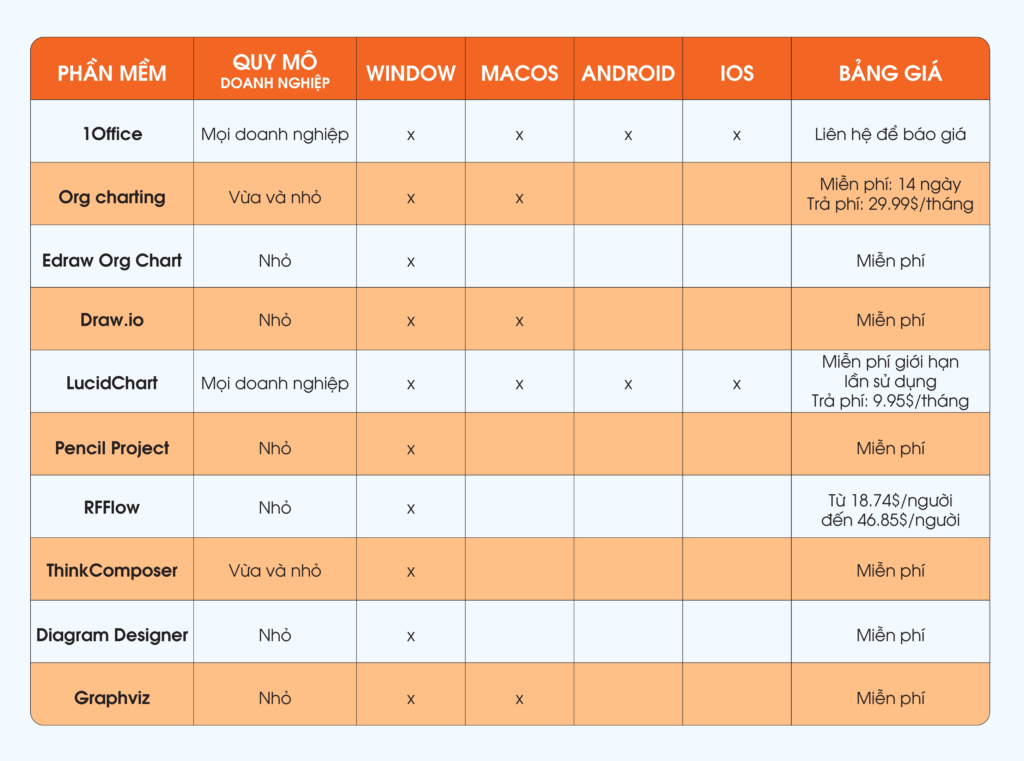
2. TOP 10 Best Online Workflow Diagram Software in 2026
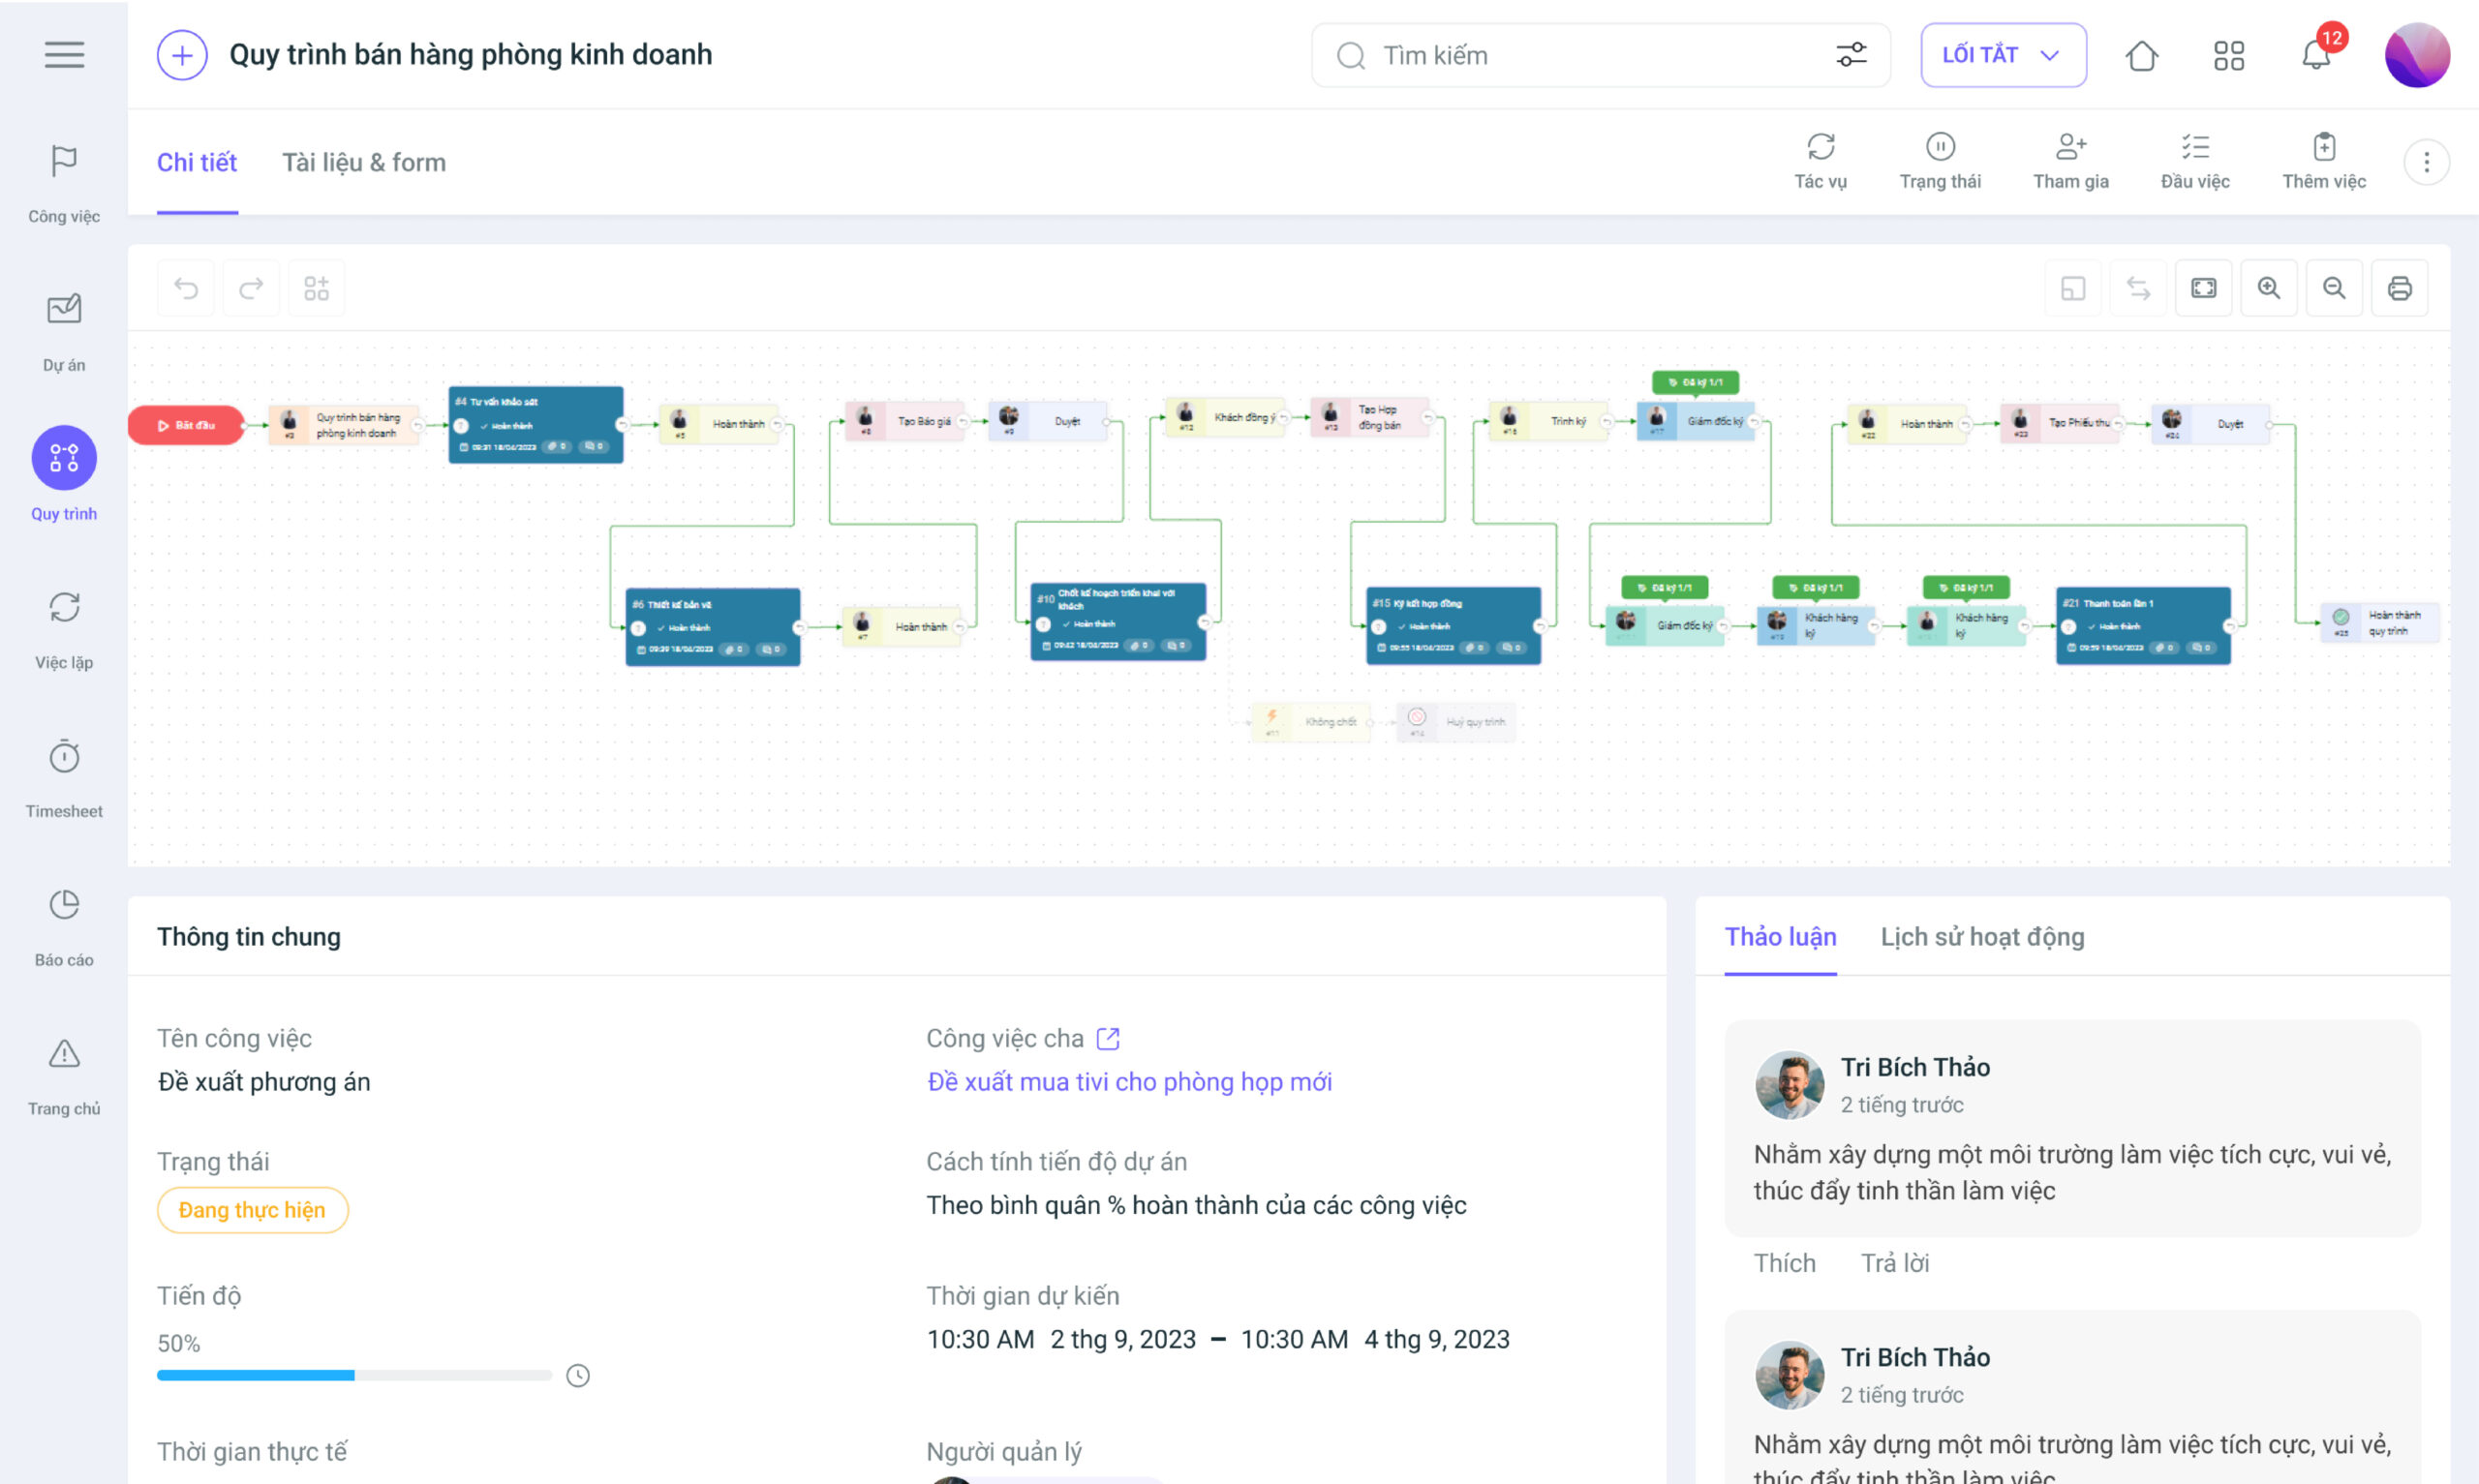
2.1. 1Office Business Process Management Software
1Office is known as a software that helps optimize overall business operations and management with its superior process automation feature, reducing manual intervention and optimizing work time, suitable for all business sectors and sizes.
Currently, 1Office software is chosen and trusted by over 500,000 users and 6,000 Vietnamese businesses with outstanding features that help you manage and draw automated process diagrams, such as:
- Digitize and automate up to 90% of all business processes.
- Set up flexible dynamic processes, allowing businesses to operate easily with branching conditions and logic conditions customized to their needs.
- Assign each process step to a specific department or individual, while tightly controlling access rights to ensure data security.
- Track the status of each step: the system displays the person currently handling it, the execution time, and automatically sends alerts for delays.
- Supports direct digital signing within the process, promoting 100% digital transformation and completely eliminating manual paperwork.
- Measure the average completion time of each process, analyzing and recommending improvements for frequent bottlenecks.
- Automatically update KPIs and OKRs when employees complete tasks, helping businesses evaluate performance transparently and continuously.
- Approval and reporting processes are also automated, minimizing manual paperwork.
- Reduce costs, save time, and improve operational accuracy.
- Flexibly integrate with other systems via API and Webhook, creating an open platform for business expansion.
In addition, 1Office also integrates Low-Code and AI, creating a powerful platform that helps businesses independently design and optimize processes without extensive programming expertise.
Low-Code: Allows users to build applications and automated processes through a drag-and-drop interface, minimizing reliance on developers. This helps accelerate deployment and reduce costs.
- Create automated processes: Users can easily set up and manage business processes by dragging and dropping available nodes without coding.
- Easy data management: Flexible data management and access control tools help businesses easily manipulate and control information.
AI: The AI feature helps improve processes through data analysis, trend forecasting, and work optimization.
- Automated analysis and decision-making: AI not only helps analyze data but also automatically makes decisions based on the information collected.
- Workflow optimization: AI learns and continuously optimizes workflows, helping to increase efficiency and minimize errors.
1Office is the #1 software on the market for managing and automating business processes, helping to optimize the user experience and improve work performance. The software also allows tasks and processes to be displayed in various views, such as: List, Gantt chart, Calendar, and Kanban. This allows users to flexibly switch between views to track and manage work more effectively.
| For further reading: 5 Steps to build an effective process management system with 1Office |
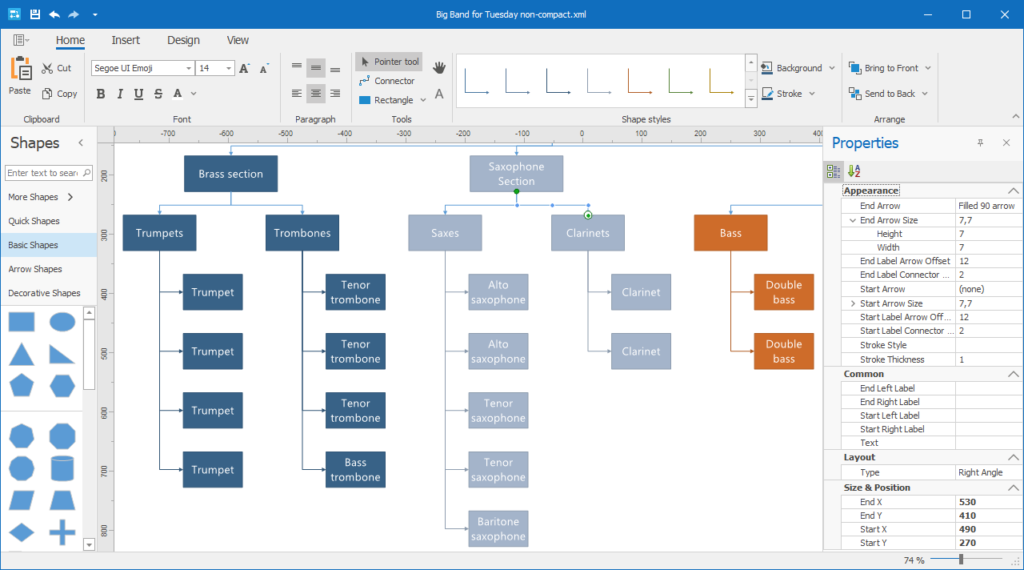
2.2. Org Charting Business Diagram Tool
The Org Charting business diagram tool is software specially designed to create company process diagrams, organizational structure charts, and work plan diagrams easily and quickly. Here are some of its outstanding features:
- Easily edit diagrams with simple operations, allowing you to add and customize members, departments, positions, and the relationships between components in the organization.
- Multiple themes and pre-made diagram templates are available for you to choose from and customize. The tool also supports exporting to PDF, Word, and HTML files.
However, Org Charting focuses mainly on creating and managing organizational charts, so it has limitations in some complex and flexible features like building process diagrams or business management diagrams. This software is only suitable for small and medium-sized businesses and does not support mobile use.
| Advantages | Disadvantages |
| Specializes in drawing organizational charts
– Intuitive drag-and-drop interface – Supports large data sets and multiple hierarchical levels – Offers many visually appealing chart templates |
– Primarily serves organizational charts, with limited support for other chart types
– Relatively high cost for small businesses |
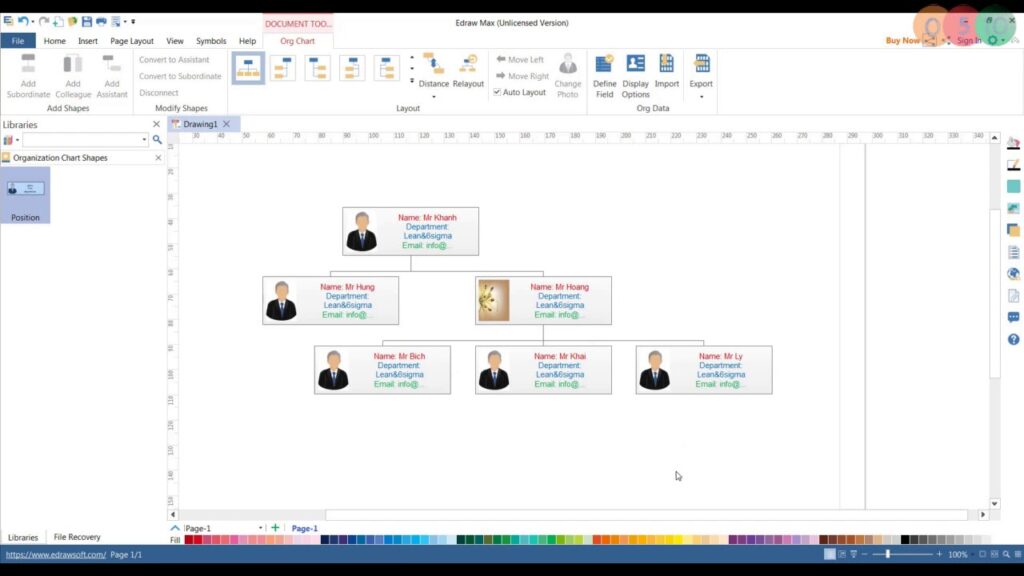
2.3. Edraw Org Chart Workflow Drawing Software
Edraw Org Chart workflow drawing software is a powerful tool designed to create and manage organizational charts, structural diagrams, and company charts. The outstanding features of Edraw Org Chart include:
- Offers professionally designed interface templates and an automatic element arrangement feature to help create clear and easy-to-read organizational charts.
- The software allows you to customize the format, color, and font style of elements in the organizational chart. You can also easily edit and adjust the chart to your needs without difficulty.
- Add images and links to shapes within the organizational chart to create more dynamic and informative diagrams, while also showing relationships and detailed information about each member of the organization.
Edraw Org Chart is an organizational chart drawing software but has limitations in supporting complex workflows. If you are looking for software capable of drawing detailed and complex workflows, you can consider: 1Office, LucidChart.
| Advantages | Disadvantages |
| Specializes in creating organizational charts
– Intuitive drag-and-drop interface – Supports large datasets and multiple hierarchical levels – Offers many visually appealing chart templates |
– Primarily serves organizational charts, with limited support for other chart types
– Relatively high cost for small businesses |
2.4. Draw.io Diagramming Software
Draw.io diagramming software is an easy-to-use tool for building various types of diagrams and charts, including organizational charts, process diagrams, workflow diagrams, and more. Specifically:
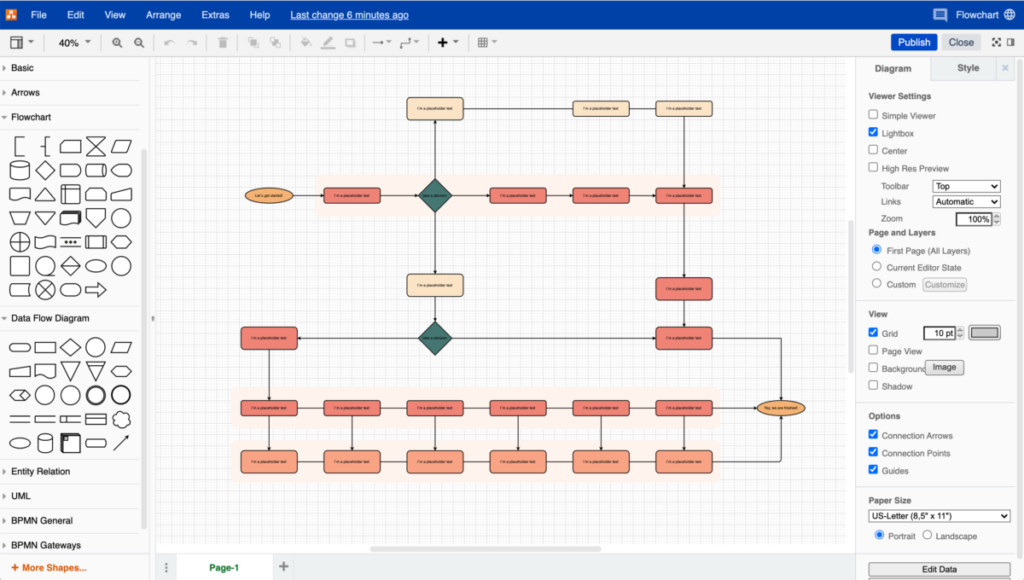
- Draw.io provides drawing tools and options in the left column of the interface, allowing you to select images, charts, and symbols and drag and drop them onto the canvas.
- It supports saving diagrams to cloud services like Google Drive, OneDrive, or directly to your hard drive. This helps you access and share your diagrams from anywhere and on any device.
As it is a free version, Draw.io is quite simple, lacks tools for creating complex diagrams, and does not offer the advanced features found in other diagramming software.
| Pros | Cons |
| – Completely free, open source
– Supports various diagram types: flowcharts, mind maps, organizational charts – Can be used online or offline – Easily save to Google Drive, OneDrive |
– The free version has limited features
– The interface is a bit outdated compared to modern software |
2.5. LucidChart Diagramming Software
LucidChart is an option for businesses looking for professional diagramming software. The tool does not require users to register an account to use it; simply visit the website and start drawing quickly and easily. Some of the software’s standout features include:
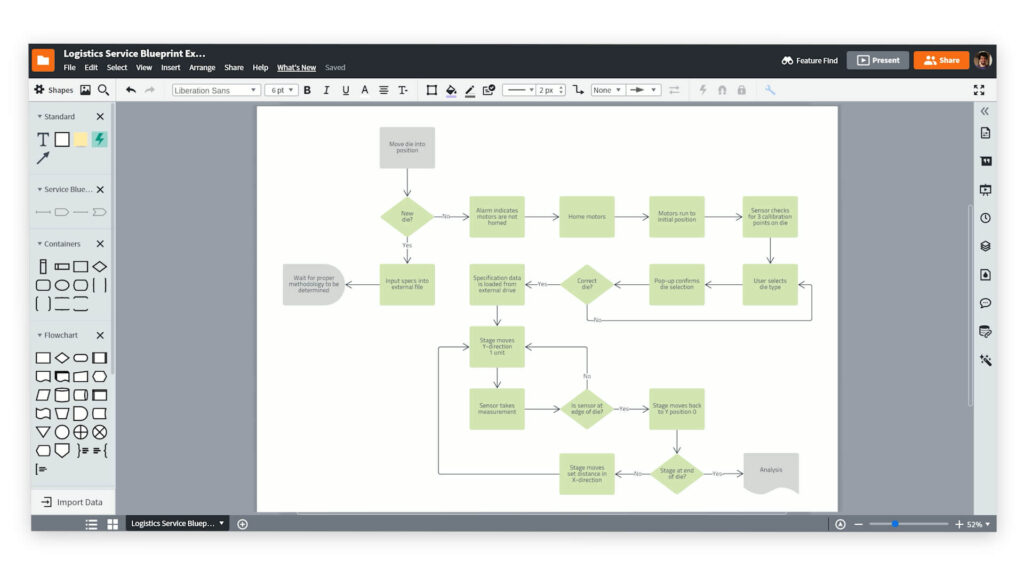
- LucidChart provides an easy-to-use and intuitive user interface that allows users to easily drag and drop any component in the diagram.
- The tool allows for teamwork on the same diagram, which helps increase work efficiency and collaboration among team members.
- The tool supports sending notifications and receiving feedback among team members. Additionally, users can discuss, ask questions, or provide opinions on the diagram through the chat feature or comment system.
However, a limitation of LucidChart is the lack of diversity and categorization of shapes for different areas, making it more difficult to find and use specific shapes.
| Pros | Cons |
| – Modern, extremely easy-to-use interface
– Supports real-time teamwork – Powerful integration with Google Workspace, Slack, MS Teams – Diverse diagram types: flowchart, mind map, organizational, IT process… |
– Free version has a limited number of diagrams
– Paid version is expensive for large teams |
2.6. Pencil Project Process Diagram Software
Pencil Project allows users to easily export and import diagram files in formats such as images, PDF, SVG, or other file types. This is very useful when businesses want to share diagrams or integrate them into other documents. The ability to customize diagram elements, properties, and styles—such as the color, size, border style, and background of shapes—allows you to create diagrams to your liking.
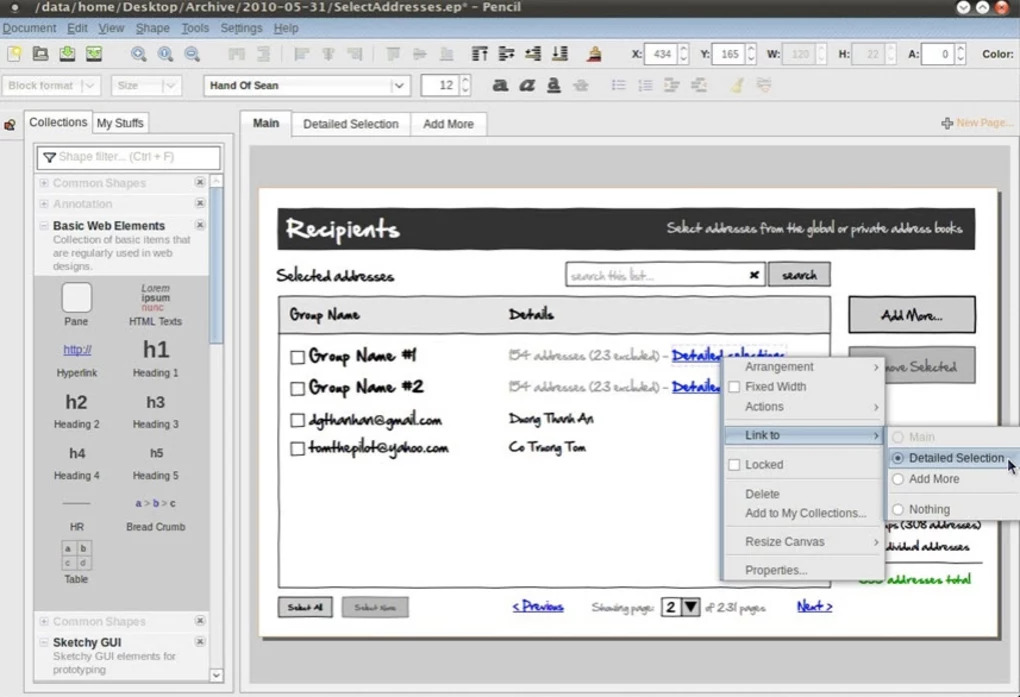
However, this software has some limitations that businesses should consider, such as support and update features that may not be provided as fully or regularly as other similar software.
| Pros | Cons |
| – Free, open-source
– Suitable for drawing wireframes, UI mockups, and basic diagrams – Lightweight, does not require high-end computer specifications |
– Not specialized for organizational charts or flowcharts
– Feature updates are quite slow, classic interface |
2.7. RFFlow Process Drawing Tool
RFFlow is the ideal software for creating a variety of organizational charts for fields such as education, business, electronic diagrams, charts, and many other types of diagrams. The tools and features are arranged logically and intuitively in the interface, helping users find and use them conveniently.
The software allows users to share and export diagrams as images, PDF files, or other file formats. This helps businesses easily store, print, or share diagrams, increasing productivity for departments.
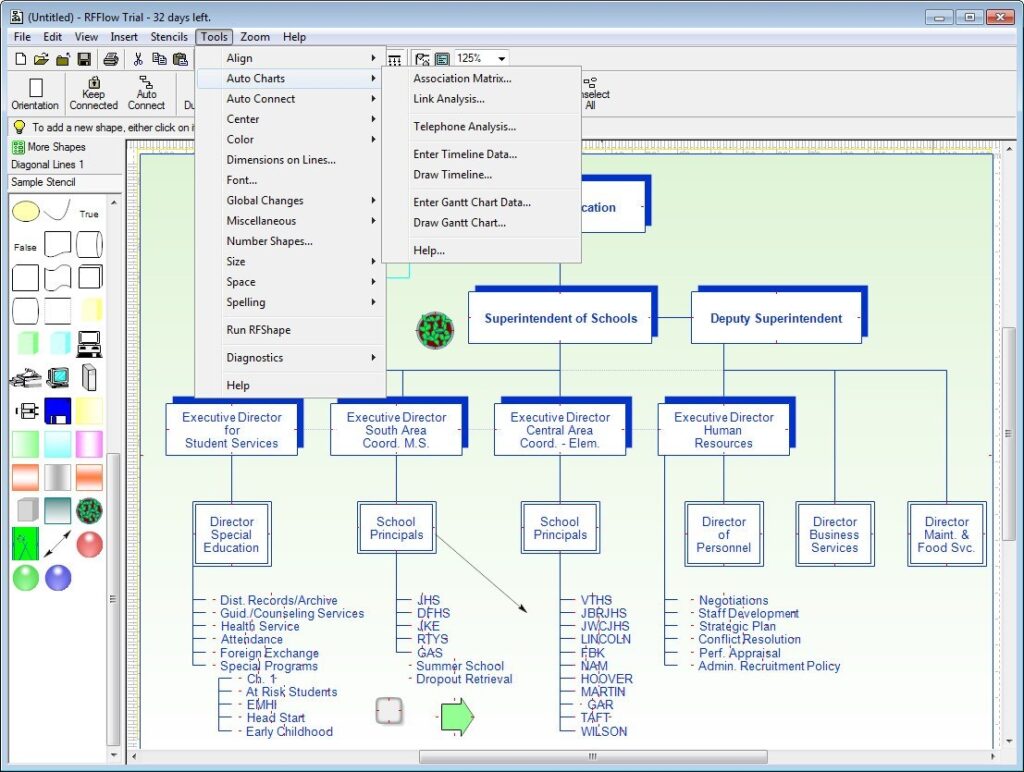
A limitation of the RFFlow diagramming software is that it only runs on the Windows operating system, making it incompatible with other operating systems like macOS or Linux. Additionally, RFFlow is a paid software, and you need to purchase a license to use all of its features.
| Pros | Cons |
| – Traditional, long-standing software
– Supports many types of technical and business diagrams – Diverse template library |
– Outdated interface, difficult for new users to approach
– Only has a desktop version, no cloud version – Limited support for teamwork |
2.8. ThinkComposer Mind Mapping Tool
ThinkComposer is a mind mapping and information management tool used to help organize ideas, analyze complex information, and build logical models. Here are some of ThinkComposer’s features and highlights:
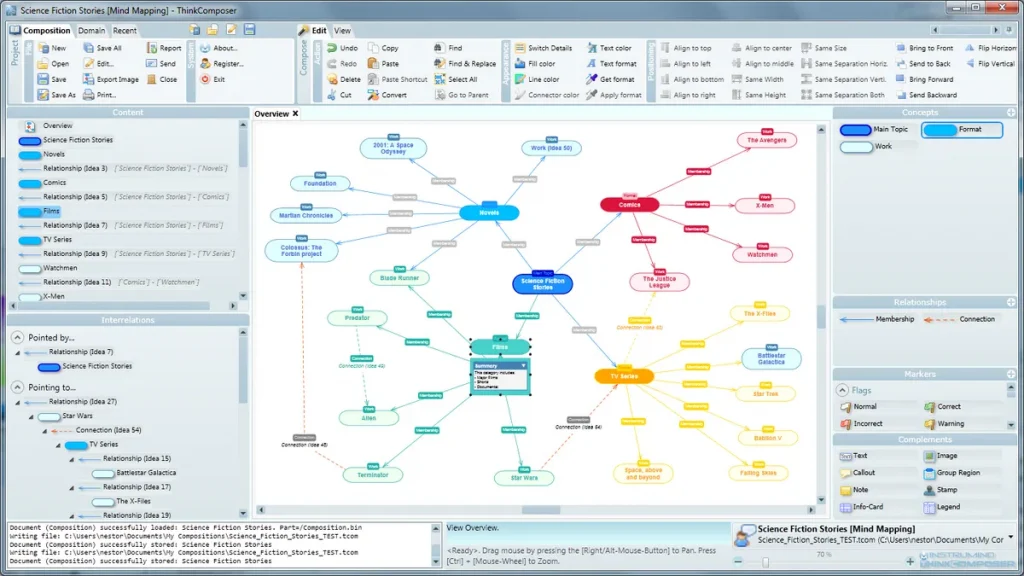
- ThinkComposer provides a flexible interface and tools to create and organize mind maps such as diagrams, data structures, relationship models, and many other types of charts to display and analyze information.
- ThinkComposer allows users to freely express ideas and information in their own way while also supporting the insertion of notes, citations, etc., into the diagrams.
ThinkComposer’s interface and features are difficult to use, requiring businesses to take time to get acquainted and become proficient.
| Advantages | Disadvantages |
| – Supports creating complex, multi-layer diagrams
– Deep customization of elements within the diagram – Suitable for in-depth system or business analysis |
– High difficulty of use, takes time to learn
– The interface is quite heavy and complex for general users |
2.9. Simple Diagramming Tool: Diagram Designer
This is a diagramming application for individual users, designed for creating simple and easy-to-use diagrams. Some key features and highlights of Diagram Designer include:
- Intuitive, simple, and user-friendly interface.
- Ability to change colors, sizes, text styles, etc.
- Supports exporting and sharing as images, PDF files, or HTML files.
However, users can only use the features available within the tool, as it does not support plugins or other extensions. Due to its simple interface, Diagram Designer also does not support drawing complex diagrams that require multiple processes.
| Pros | Cons |
| – Free, lightweight, and quick to install
– Suitable for drawing basic diagrams, flowcharts, and simple charts – Integrates spell check and presentation slide management features – Supports multiple file saving formats |
– Simple, unattractive interface
– Few advanced features for teamwork or complex diagrams – Does not support real-time collaboration or cloud platform integration |
2.10. Graphviz Online Diagramming Software
Graphviz is a specialized online diagramming software for creating and displaying graphs. The software provides various layouts to automatically arrange diagrams, including hierarchical layouts, radial layouts, and many other types.
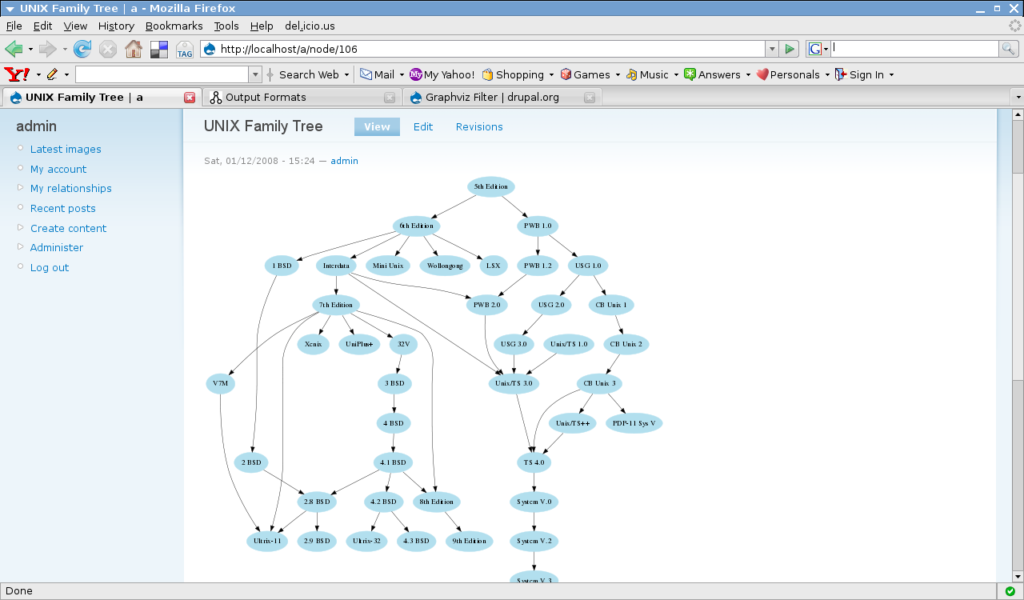
However, Graphviz has limitations in color codes, limited customization features, and its graph editing tools are not as rich as other professional graphing tools.
| Advantages | Disadvantages |
| – Powerful tool for drawing diagrams from code (text-based input)
– Creates complex diagrams, automatically adjusts for optimal layout – Suitable for handling large diagrams, IT system diagrams, and computer networks |
– No drag-and-drop interface; requires knowledge of syntax to use
– Difficult for general users to access – Does not support direct teamwork or visual editing |
3. What are the benefits of diagramming software?
More than just an illustration tool, diagramming software offers many practical benefits for businesses and individuals in managing and operating their work:
Visualize complex information
Multi-step processes, vast amounts of data, or multi-layered organizational structures are often difficult to visualize through text alone. With software, everything is “translated” into shapes, arrows, and connecting branches – helping viewers grasp the information quickly in just a few seconds.
For example: Instead of reading a lengthy 5-7 step approval process, a flowchart immediately shows who approves first, who approves next, and how the workflow moves.
Faster communication and coordination
In teams, especially remote ones, diagrams act as a “common language.” By simply looking at a Gantt chart or a process diagram, each member clearly understands their responsibilities and position, avoiding misunderstandings or omissions.
The software also allows for direct sharing via links, exporting files, or embedding into reports – very convenient for cross-departmental work.
Make accurate and timely decisions
A clear diagram helps managers easily identify “bottlenecks” in a process: which stage is slow, which departments have overlapping tasks. This provides a basis for them to adjust, optimize resources, and reassign work promptly.
In particular, an organizational chart (Org Chart) also helps leaders quickly visualize the personnel structure and plan for restructuring when necessary.
Save training & onboarding time
For new employees, instead of reading dozens of pages of documents, they can understand how the company operates just by looking at a process diagram or an organizational chart. This shortens the training period and helps employees integrate quickly.
Enhance efficiency & transparency in work
Diagrams like Gantt charts or Kanban boards in software allow for real-time tracking of work progress. Everyone can clearly see deadlines, who is in charge of what, and how far along the work is.
This makes management transparent, reduces missed deadlines, and increases overall work efficiency. Additionally, data from the diagrams can be used for quick reports to superiors or partners.
Benefits of using diagramming software
4. Frequently Asked Questions
Should I use online or desktop diagramming software?
If you need to collaborate with a team, share quickly, and make flexible updates, an online version is preferable. If your needs are simple or you work individually on one machine, a desktop installation can still be suitable.
Which diagramming software is easy for beginners?
Beginners should choose a tool with a drag-and-drop interface that is easy to learn and doesn’t require highly technical operations. Diagramming software like Draw.io, Lucidchart, or Diagram Designer are easier options to start with.
Is there free diagramming software?
Yes. Some free and accessible tools include Draw.io, Pencil Project, Diagram Designer, and Graphviz.
Which diagramming software is suitable for creating mind maps?
ThinkComposer is a more suitable tool if you want to create mind maps or idea diagrams.
Is there any diagramming software that integrates with work management tools?
Yes. 1Office’s workflow diagram software is suitable if a business wants to both draw and digitize processes, as well as track handlers, execution time, delay alerts, and manage tasks all on the same system
5. Conclusion
Above is a compilation of the most professional and effective workflow diagramming software available today. Businesses can review which tool best suits their needs and purposes. Or contact us via Hotline: 083 483 8888 for a consultation on 1Office’s workflow diagramming software.
- Hotline: 083 483 8888
- Facebook: https://www.facebook.com/1officevn/
- Youtube: https://www.youtube.com/@1office-chuyendoisodn