9 Latest Business Financial Management Excel Files for 2026
When cash flow lacks transparency, costs are wasted, and financial decisions become subjective – businesses will soon find themselves in a reactive situation. Even if you can’t fully digitize yet, you can still control your financial situation more effectively with the 6 latest professionally designed corporate financial management Excel file templates for 2026 below. Download for free and apply them to your business now!
Mục lục
- 1. What is a corporate financial management Excel file?
- 2. How to identify types of business expenses
- 3. How to control finances transparently and effectively?
- 4. Basic contents of a financial management Excel file
- 5. A collection of 9 corporate financial management Excel files
- 5.1 Balance Sheet Excel File Template
- 5.2 Financial Forecast Excel File Template
- 5.3 Break-even analysis Excel file template
- 5.4 Cash flow statement Excel file template
- 5.5 Revenue and expense management report Excel file template
- 5.6 Excel file template for business profit and loss forecast
- 5.7 Excel File Template for Debt Management
- 5.8 Excel File Template for Business Cash Flow Management
- 5.9 Fixed Asset Management Excel File Template
- 6. Advanced Guide to Optimizing Your Financial Management Excel File
- 7. Pros and cons of using Excel files for corporate financial management
- 8. 1Office Corporate Financial Management Solution
- 9. Frequently Asked Questions about Corporate Financial Management Excel Files
1. What is a corporate financial management Excel file?
A corporate financial management Excel file is one or more Excel spreadsheets specially designed to systematically track, record, calculate, and analyze all of a company’s financial activities. It is the most popular tool for small and medium-sized enterprises (SMEs) in Vietnam due to its flexibility, low cost, and ease of customization without the need for expensive specialized accounting software.
Key roles and purposes
This Excel file replaces or supplements traditional accounting books, helping businesses:
- Track daily revenue and expenses.
- Manage accounts receivable/payable.
- Calculate profit, cost of goods sold, cash flow.
- Create basic financial statements (income statement, balance sheet, cash flow statement).
- Forecast and create financial plans (budgets, projected cash flow)
2. How to identify types of business expenses
Tracking and controlling the types of expenses in a business helps leaders ensure that resources are used effectively to achieve the highest profit. Below is a list of these 5 types of fixed costs:
- Personnel costs: These are costs related to salaries, benefits, insurance, and other allowances for employees.
- Office expenses: Includes office space rent, electricity, water, Internet, telephone, and other costs related to office operations.
- Marketing and advertising costs: These are costs for promoting the company’s products or services, including media advertising, online marketing, market research, and other marketing activities.
- Production costs and operating costs: Includes costs related to the process of producing goods or providing services, such as raw material costs, machinery, direct labor, and other operational activities.
- Administrative and financial costs: Includes general administrative costs of the company, such as executive salaries, management department expenses, consulting fees, audit fees, and financial costs like loan interest and bank service fees.
See more:
3. How to control finances transparently and effectively?
To control finances transparently and effectively, businesses need to combine detailed budget planning, close monitoring of actual cash flows, and the application of technology to automate management processes.
Here are the core methods to optimize financial health:

3.1 Create a clear financial plan
This is the process of researching, analyzing, and determining cost levels based on the company’s standards, data, and strategies. Businesses need to define financial goals, contingencies, and desired profits with specific figures while creating monthly, quarterly, and annual budget plans to monitor and evaluate the company’s financial situation.
This helps leaders control finances effectively, ensuring that expenses are managed and used thoughtfully and reasonably.
3.2 Analyze actual expenditures
This is a crucial factor that helps managers analyze and review the company’s actual expenditures. Businesses need to examine each expense in detail and identify unnecessary or reducible spending. This is not just the responsibility of the accounting department; all departments in the organization need to review rent, advertising costs, salaries, and other expenses to propose solutions and be more proactive in financial management.
3.3 Apply technology to management
Using technology – corporate financial management software is an effective solution that helps businesses optimize processes and minimize manual work. The software helps the accounting department automate financial tasks, generate automatic reports, and provide accurate and timely financial information. This helps save time and energy while minimizing errors and increasing accuracy in financial management.
3.4 Establish financial reserves
Effective corporate financial management includes establishing smart financial reserves. This is a crucial factor for dealing with emergencies or unexpected situations, such as financial incidents or revenue loss. Businesses need to determine an appropriate level of financial reserves to ensure normal operations and maintain financial stability.
4. Basic contents of a financial management Excel file
A corporate financial management Excel file will include information and data related to managing and reporting the business’s performance. This includes:
- Balance Sheet: This sheet records all assets, capital sources, revenues, and expenditures over a specific period, such as fixed assets, current assets, liabilities, owner’s equity, revenue, and expenses.
- Cash Flow Statement: Reflects the company’s cash flow from operating, investing, and financing activities over a certain period.
- Income Statement: Also known as the profit and loss (P&L) statement, this sheet shows the company’s revenue, expenses, and profit over a specific period.
- Financial Forecast Sheet: Helps managers forecast future revenue, expenses, and profit, thereby contributing to setting clear financial goals for the business.
- Capital Reserve Sheet: Provides an overview of the company’s financial situation, including assets, liabilities, and owner’s equity, to determine capital needs and manage finances more effectively.
- Cash Flow Projection Sheet: Forecasts the company’s expected cash flow to assess financial capacity and define necessary measures to ensure cash circulation.
However, the content of each financial management Excel file can be customized and supplemented with information that suits the specific requirements of the business.
5. A collection of 9 corporate financial management Excel files
5.1 Balance Sheet Excel File Template
The balance sheet helps businesses record and balance assets, liabilities, and capital sources to ensure the accuracy and balance of financial items. This helps managers and investors understand the company’s financial situation and assess its solvency and profitability. The necessary content in a balance sheet includes:
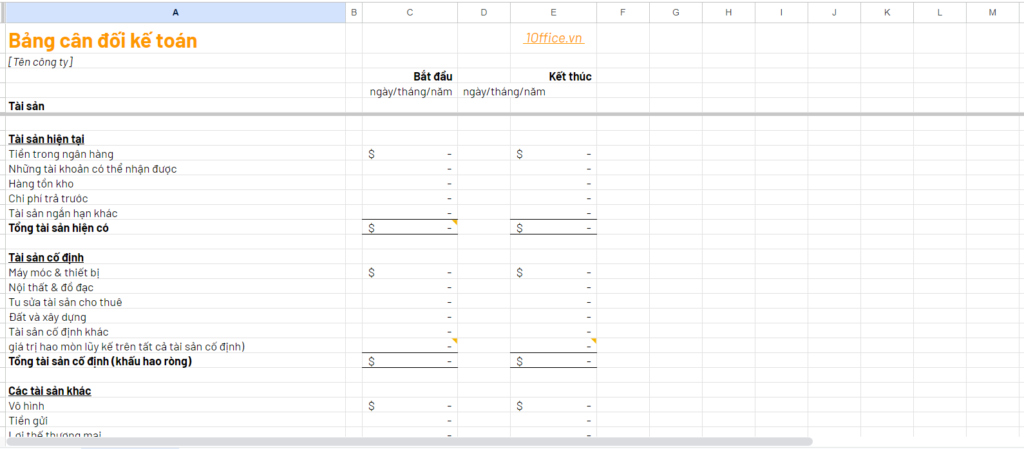
- Items column: Lists the company’s asset, liability, and equity items. For example: current assets, fixed assets, short-term liabilities, long-term liabilities, owner’s equity, etc.
- Opening balance column: Records the balance of each item at the beginning of the period. The opening balance is the amount available in each item from the previous financial statement.
- Transactions column: Records transactions during the current period, including increases and decreases in asset, liability, and equity items.
- Closing balance column: Calculates the total closing balance for each item by adding the opening balance and the transactions during the period. The closing balance represents the amount available in each item at the end of the period.
- Notes column: Provides additional information, notes, or explanations about the items and transactions in the balance sheet.
>> DOWNLOAD: Sample Balance Sheet Report for Businesses
5.2 Financial Forecast Excel File Template
A financial forecast template helps estimate and predict a company’s future financial situation. It helps managers shape strategies, create financial plans, assess solvency, make investment decisions, and generate profits. The content of a financial forecast Excel sheet includes:
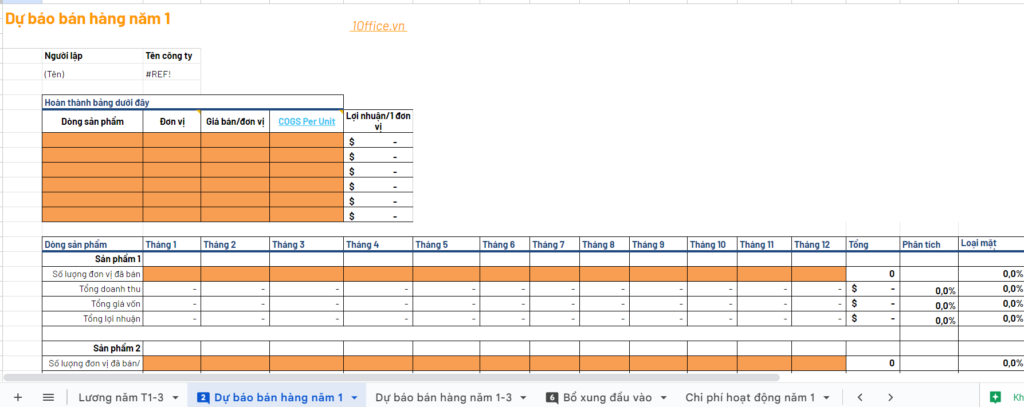
- Revenue column: This column is for predicting and recording the company’s expected revenue for each time period.
- Expenses column: This column includes projected expense items such as operating costs, selling expenses, administrative expenses, marketing costs, employee costs, etc.
- Gross profit column: Gross profit is the profit earned after deducting the cost of producing goods or providing services. This column shows the projected gross profit for each period.
- Financial costs column: This is the column for recording projected financial costs such as interest rates, interest payments, loan fees, etc.
- Net profit column: Net profit is the profit after deducting all expenses, including production costs, financial costs, and other expenses. This column shows the projected net profit for each period.
- Cash flow from operating activities column: This column records the projected cash flow from business operations, such as cash received from sales, customer payments, payments to suppliers, etc.
- Cash flow from investing activities column: This is the column for recording projected cash flow from investing activities, such as purchasing fixed assets, investing in financial instruments, etc.
- Cash flow from financing activities column: This column records the projected cash flow from financing activities, such as borrowing, debt repayment, dividends paid to shareholders, etc.
- Net cash flow column: This column is for calculating the net cash flow by summing the cash flows from operating, investing, and financing activities.
>> DOWNLOAD: Corporate financial forecast template
5.3 Break-even analysis Excel file template
The break-even analysis template is used to assess a company’s ability to recoup its investment. It allows management to measure financial performance and evaluate the sustainability of the business model.
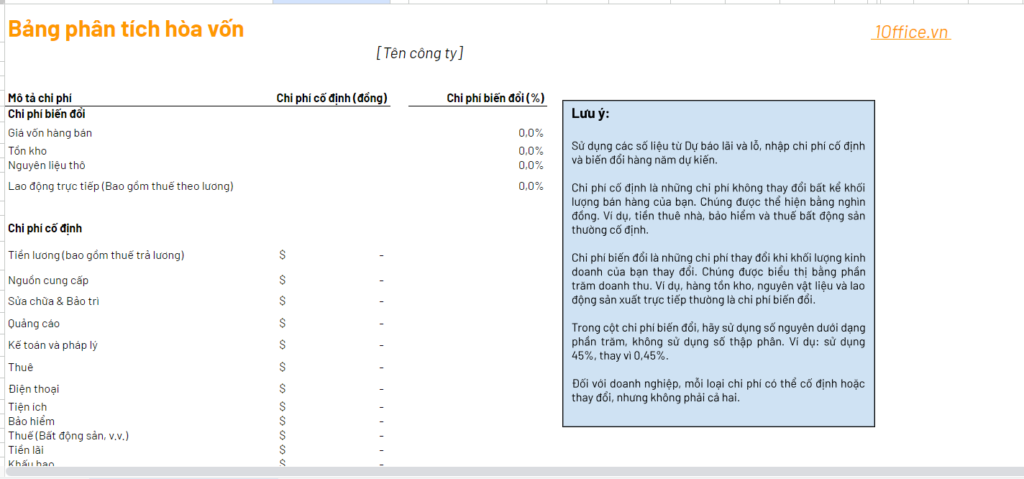
- Revenue column: Records revenue or sales for each period.
- Gross profit column: The profit earned after deducting the cost of producing goods or providing services.
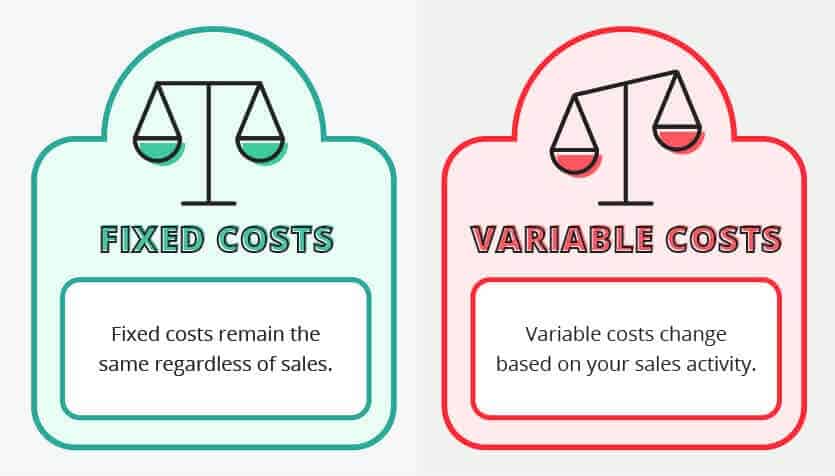
- Fixed costs column: Records fixed costs that do not depend on the company’s level of activity. For example: rent, management staff salaries, etc.
- Variable costs column: Records variable costs that can change with the company’s level of activity. For example: raw material costs, transportation costs, etc.
- Total costs column: This column calculates the total cost by summing up fixed and variable costs.
- Net profit column: Net profit is the profit remaining after deducting all costs, including both fixed and variable costs. This column shows the net profit corresponding to the revenue in each period.
- Investment capital column: This column records the initial investment capital of the business or the amount of equity required to start.
- Break-even point column: The break-even point is calculated by dividing net profit by investment capital and multiplying by 100 to express it as a percentage, which shows the efficiency of capital investment usage.
>> DOWNLOAD: Break-even analysis template
5.4 Cash flow statement Excel file template
The cash flow statement provides information about the cash flows and cash fluctuations of a business over a specific period. This report helps readers better understand the sources and uses of cash in the company’s operating, investing, and financing activities. It includes information columns such as:
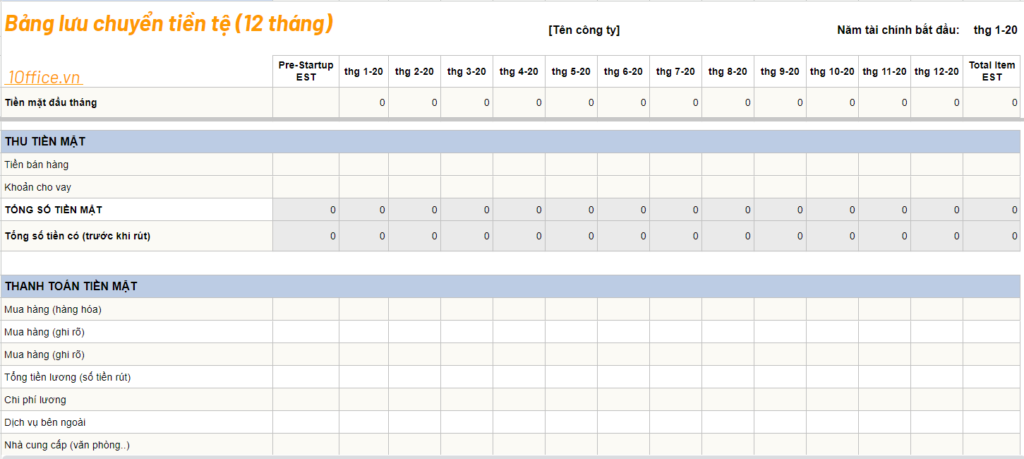
- Cash flow from operating activities column: Includes net profit, adjustments to net profit, changes in working capital, non-cash expenses, and other cash flows from operating activities.
- Cash flow from investing activities column: Includes cash received from selling fixed assets, cash paid for fixed assets, cash received from other investments, and cash paid for other investments.
- Cash flow from financing activities column: Includes cash received from borrowing, cash paid for debt repayment, and other cash flows from financing activities.
- Total cash flow column: Calculates the total cash flow from operating, investing, and financing activities.
- Increase/decrease in cash column: Records the increase or decrease in cash for each period.
- Beginning/ending cash balance: This column records the company’s beginning/ending cash balance.
>> DOWNLOAD: Cash flow statement template
5.5 Revenue and expense management report Excel file template
The revenue and expense management report template helps leaders track and control the company’s revenue and expense activities. This allows them to evaluate the efficiency of resource utilization and make necessary decisions to adjust and optimize the company’s financial operations. A revenue and expense management report template may include the following information columns:
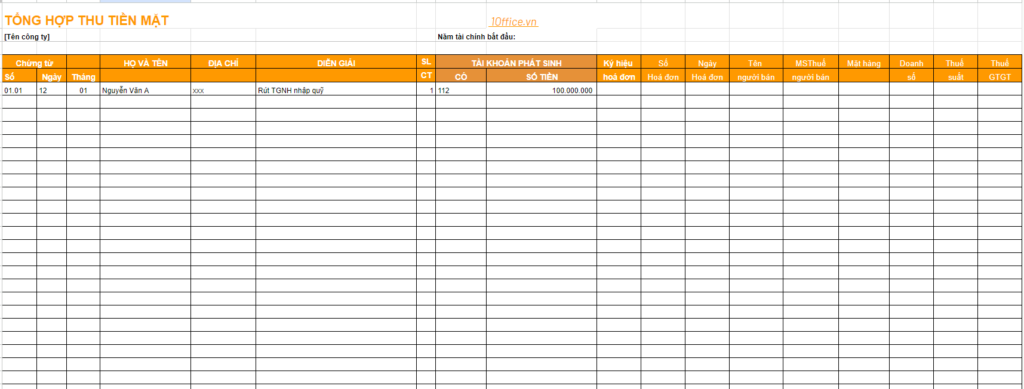
- Time column: Records the date or month corresponding to the revenue and expense transactions.
- Description column: Provides a detailed description of the purpose or content of the revenue/expense transaction.
- Revenue/Expense type column: Includes sales, rent, raw material purchases, employee salaries, etc.
- Revenue/Expense amount column: Records the amount of revenue received or expense paid in the corresponding transaction.
- Total revenue/Total expense column: This column calculates the total amount of revenue/expense in each period.
- Grand total column: Calculates the total revenue and expenses in each period.
- Balance column: Records the final balance after calculating revenue and expenses.
>> DOWNLOAD: Revenue and expenditure management report template
5.6 Excel file template for business profit and loss forecast
The Excel file template for business profit and loss forecast is designed to estimate and predict the company’s future financial results. Profit and loss forecasting helps management make business decisions, create financial plans, and set development directions. Below is a basic template for a business profit and loss forecast:
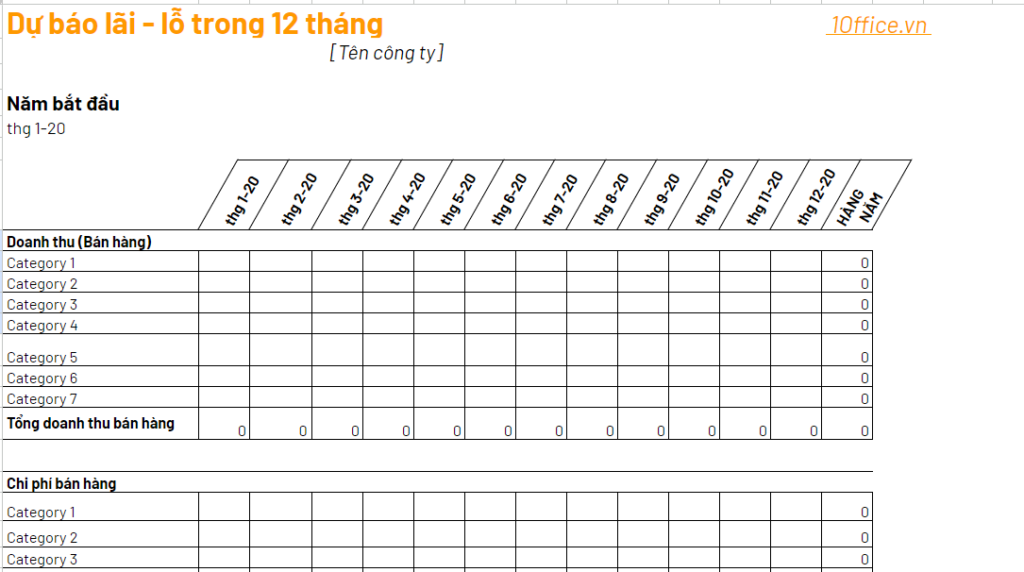
- Revenue column: Estimate revenue from the company’s business activities. It can be divided into different product types, services, or sales channels.
- Cost of Goods Sold (COGS) column: This column records the estimated cost to produce or provide products and services. It includes direct costs related to the production or provision of goods and services.
- Gross Profit column: Calculate the total gross profit by subtracting the cost of goods sold from revenue.
- Operating Expenses column: Estimate other business operating expenses such as administrative expenses, marketing expenses, selling expenses, research and development costs, etc.
- Operating Profit column: Calculate the total operating profit by subtracting operating expenses from gross profit.
- Financial Expenses column: Estimate financial expenses such as loan interest, interest rate costs, credit costs, etc.
- Profit Before Tax column: Calculate the total profit before tax by subtracting financial expenses from operating profit.
- Tax Expense column: Estimate corporate income tax expense.
- Profit After Tax column: This column calculates the total profit after tax by subtracting tax expense from profit before tax.
> DOWNLOAD: Business profit and loss forecast template
5.7 Excel File Template for Debt Management
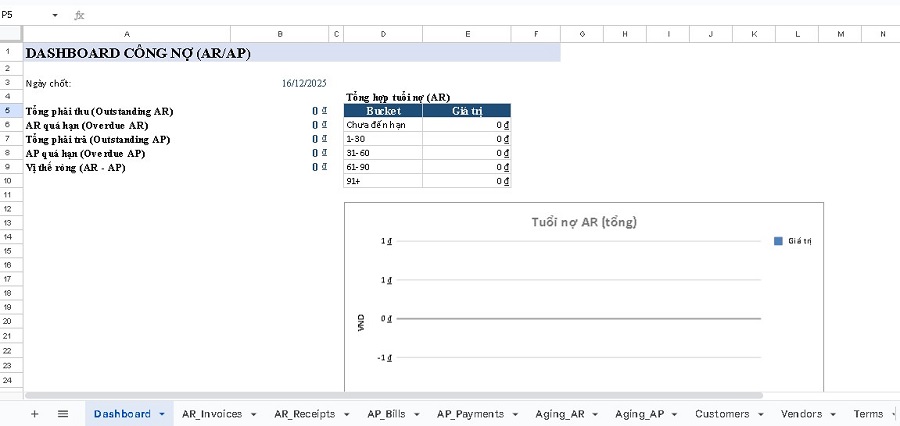
Parameters in the file?
- AR_Invoices: Accounts receivable by invoice (auto-calculates VAT, total invoice, amount received, amount outstanding, due date, status, overdue)
- AR_Receipts: Cash receipt vouchers (multiple receipts for one invoice → auto-summed into AR_Invoices)
- AP_Bills: Accounts payable by bill (auto-calculates similarly)
- AP_Payments: Payment vouchers (auto-summed into AP_Bills)
- Aging_AR / Aging_AP: Aging report by customer/vendor (Not due, 1–30, 31–60, 61–90, 91+)
- Dashboard: Total AR/AP, overdue, net position + aging chart
- Customers / Vendors / Terms / Settings / Guide: categories + dropdown + report closing date
Quick start guide
- Settings → adjust the Report closing date
- Customers/Vendors/Terms → enter categories
- AR_Invoices + AR_Receipts and AP_Bills + AP_Payments → enter data → dashboard runs automatically
DOWNLOAD: Excel file template for debt management
5.8 Excel File Template for Business Cash Flow Management
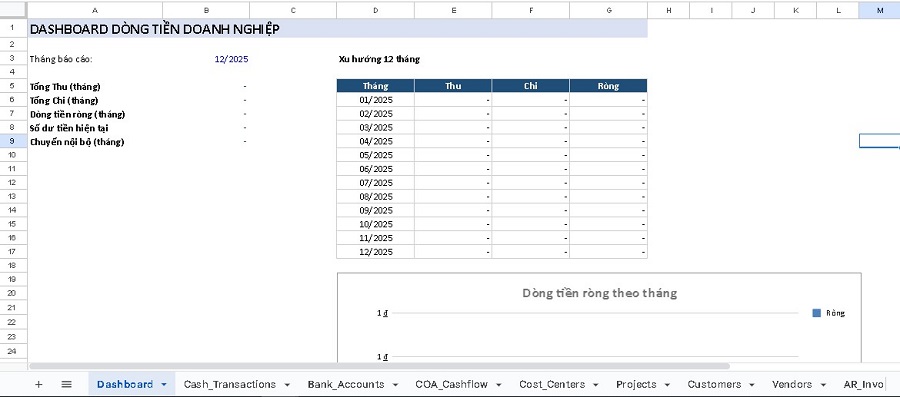
Parameters in the file
- Dashboard: Total Inflow/Outflow/Net by month + 12-month trend + chart
- Cash_Transactions: Inflow–outflow–internal transfer ledger (dropdown for Type/Category/Account/Cost Center/Project…)
- Bank_Accounts: Manage cash accounts + current balance auto-calculated from transactions
- AR_Invoices / AP_Bills: Track accounts receivable/payable
- Forecast_12w: 12-week cash flow forecast based on AR/AP
- COA_Cashflow: Cash flow categories by CFO/CFI/CFF
- Cost_Centers / Projects / Customers / Vendors: Lists for dropdown menus
- Settings: Select reporting month + forecast start date
- Guide: Quick start guide within the file
Quick guide (3 steps)
- Settings → select Report month & Forecast start date
- Bank_Accounts → enter Opening balance (in green text)
- Cash_Transactions → enter Income/Expense/Transfer transactions → Dashboard & reports will run automatically
DOWNLOAD: Business cash flow management Excel file template
5.9 Fixed Asset Management Excel File Template
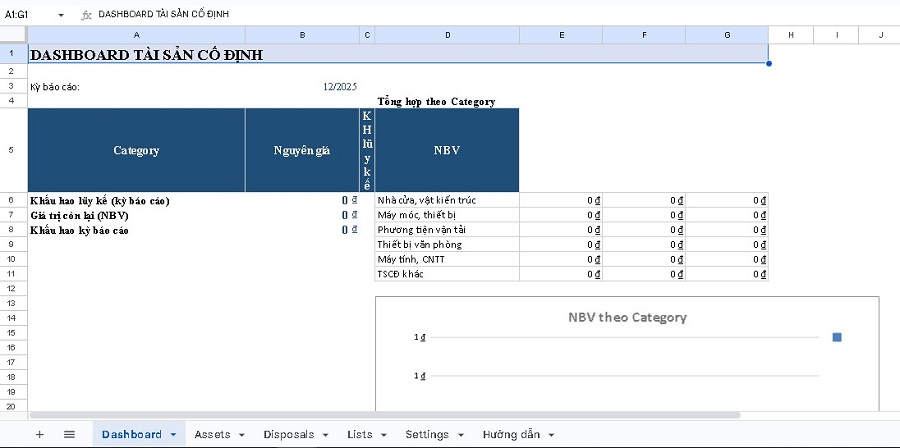
Parameters in the file
- Assets: Fixed Asset Register (asset code, original cost, salvage value, depreciation period, method, branch, cost center…)
→ Auto-calculates: Depreciation for the reporting period, accumulated depreciation, Net Book Value (NBV) - Disposals: Track disposals/sales
→ Auto-calculates: NBV at disposal date & Gain/Loss - Dashboard: Summary of original cost / depreciation / NBV + chart by Category
- Lists: Dropdown lists (Category, Branch, Cost Center, depreciation method)
- Settings: Select reporting period (month) to auto-update everything
- Guide: Quick guide within the file
Quick guide (3 steps)
- Settings → select Reporting period
- Assets → enter data in the green cells (asset information)
- If there are disposals → enter them in Disposals → Dashboard will auto-update
DOWNLOAD: Fixed asset management Excel file template
6. Advanced Guide to Optimizing Your Financial Management Excel File
Excel is a powerful tool for personal/business financial management, but to achieve high efficiency, you need to master advanced functions, dynamic reports, and data management techniques. Below is a detailed guide to help you turn your Excel file into a professional system, reducing errors and saving time.
6.1 Important Excel Functions for Accounting and Finance
Basic and advanced functions help with quick and accurate calculations.
- Basic functions:
- SUM: Total (e.g., =SUM(B2:B100)).
- AVERAGE: Average.
- COUNT: Counts cells with numerical values.
- MAX/MIN: Largest/smallest value.
- Conditional functions:
- IF: Checks a condition (e.g., =IF(B2>0,”Income”,”Expense”)).
- SUMIF/COUNTIF: Sums/counts based on one condition (e.g., =SUMIF(C:C,”Income”,D:D)).
- SUMIFS/COUNTIFS: Multiple conditions (e.g., =SUMIFS(D:D,C:C,”Income”,A:A,”>=01/01/2026″)).
- Lookup functions:
- VLOOKUP/HLOOKUP: Vertical/horizontal lookup (e.g., =VLOOKUP(A2,Table,2,FALSE)).
- XLOOKUP (Excel 365/2021+): More powerful, flexible (e.g., =XLOOKUP(A2,TableID,TableName,”Not found”)).
- Supporting tools:
- Data Validation: Restricts data entry (Data > Data Validation > List/Number).
- Conditional Formatting: Automatically formats cells based on conditions (Home > Conditional Formatting).
6.2 Building Dynamic Reports with Pivot Tables & Pivot Charts
Pivot Tables help summarize and analyze large datasets without complex formulas.
Step-by-step guide to creating a Pivot Table:
- Prepare data: A table with clear headers and no empty rows in between.
- Select the data range → Insert > PivotTable → Choose location (new/existing worksheet).
- Drag fields to areas:
- Rows: Group by (e.g., Month, Expense Type).
- Columns: Categorize horizontally (e.g., Year).
- Values: Calculation (Sum of Revenue).
- Filters: Filter data (e.g., By department).
- Customize: Value Field Settings (calculate %, average…).
Creating a Pivot Chart:
- From the Pivot Table → Insert > PivotChart.
- Choose the chart type (Column, Line, Pie…).
- Customize layout and filters for visualization (e.g., Monthly revenue chart).
Benefit: Reports update automatically when data changes – ideal for monthly/quarterly financial reporting.
6.3 Managing Data Effectively and Avoiding Errors
Clean data is the foundation of an accurate financial file.
- Data entry rules:
- Consistent formatting (date: dd/mm/yyyy, currency: VND).
- Do not leave empty cells within data → use “0” or a note.
- Use Tables (Ctrl+T) to automatically expand formulas.
- Protecting sheets and workbooks:
- Review > Protect Sheet → Set a password, allow editing only in specific cells.
- Using “Comments” for notes:
- Right-click a cell → New Comment → Note the data source or add remarks.
- Periodic data backup:
- Save as a new version weekly (FileName_20261217).
- Use OneDrive/Google Drive for auto backup.
6.4 Link Excel Files to Create a Comprehensive System
Linking helps consolidate data from multiple files (e.g., detailed file → summary file).
Instructions for creating links:
- Between sheets in the same workbook: =Sheet2!B2.
- Between workbooks: ='[FileName.xlsx]Sheet1′!$B$2 (use $ to lock the cell).
- Use INDIRECT if more flexibility is needed.
Notes on performance and errors:
- Performance: Too many links slow down the file → use Power Query (Data > Get Data) to import data instead of direct linking.
- Common error: #REF! when the source file is moved → open both files when working; update links when opening the file.
- Safer solution: Use Power Pivot or switch to Excel Online/365 for more stable cloud-based linking.
Applying these advanced techniques will transform your financial Excel file into a professional, automated, and less error-prone system. Start by standardizing data and trying Pivot Tables – you will see a significant increase in efficiency in just a few weeks!
7. Pros and cons of using Excel files for corporate financial management
| Advantages | Disadvantages |
| Easy to use: Excel is simple and very popular, making it easy to use and install.
Cost-effective: Using Excel for business financial management is very cost-effective compared to using professional financial management software. Customizable: Excel allows users to customize spreadsheets and charts according to their needs. Easy to share: Easily share spreadsheets and charts with members of the business. |
Prone to errors: Data entry mistakes or calculation errors can lead to inaccuracies in revenue and expense management.
Not secure: Excel lacks high-level security features, making it vulnerable to malware and viruses. Not suitable for large businesses: As a business grows, managing revenue and expenses with Excel becomes more complex and difficult. No automation features: Managing revenue and expenses with Excel requires manual data entry and calculations, lacking the automation features of professional financial management software. |
In summary, using Excel files for corporate financial management has many limitations and poses high risks if the files are not managed strictly. Depending on the needs and scale of the business, there are more suitable management solutions, such as using corporate financial management software.
>> See more: Top 7 Best Corporate Financial Management Software
8. 1Office Corporate Financial Management Solution
1Office is an effective corporate financial management solution, with important features and support tools such as debt digitization, direct debt creation, smart alerts, and linking debts with orders, contracts, and quotes, helping managers grasp and control the financial situation most effectively. Some outstanding features of the software include:
- Debt Digitization: 1Office allows for the digitization of all corporate debt information, helping to avoid data confusion caused by manual or Excel file storage.
- Direct Debt Creation: This solution provides pre-configured steps to create debts from customer information, contracts, and quotes, making the debt creation process fast and accurate.
- Smart Alerts: Reminders for declaration deadlines, tax payments, inventory status of materials and goods, debt collection, and invoice payments. This helps businesses automate processes and ensures no important tasks are missed.
- Debt Linking: The 1Office software links debts directly with orders, contracts, quotes, and other information, helping to prevent loss or errors in debt data. This creates connectivity and efficiency in comprehensive business management.
With the features above, 1Office can not only replace corporate financial management Excel files but also help save time and improve accuracy. Contact 1Office now for a free software trial consultation.
9. Frequently Asked Questions about Corporate Financial Management Excel Files
When should a business switch from Excel to specialized management software?
When the transaction volume is too large, causing the file to slow down, data is scattered and difficult to control, or when security and real-time coordination between multiple departments are needed, which Excel cannot meet.
How to limit data entry errors when multiple people share the same Excel file?
Use the Data Validation feature to restrict the type of data entered, combined with Protect Sheet to lock cells containing important formulas, allowing users to enter data only in specified areas.
Can a financial management Excel file automatically generate a cash flow statement?
Yes. By setting up a standardized income and expenditure data table and using the SUMIFS function or Pivot Table, Excel can automatically aggregate data into the cash flow statement whenever a new transaction occurs.
Does using Excel for financial management ensure legal compliance when working with tax authorities?
Excel is only an internal management tool. For tax finalization, businesses still need to print documents and books according to the templates prescribed by the Ministry of Finance or export data to legally recognized accounting software.
Why use management software instead of financial management Excel files?
Compared to Excel, management software like 1Office helps businesses control finances more effectively and securely because data is processed centrally and automatically:
-
- Reduces formula errors and manual data entry common in Excel.
- Data is stored centrally, preventing file loss or duplication.
- Track debts, cash flow, and reports in real-time.
- Automatically alerts for due debts, reducing the risk of forgetting or delayed processing.