20+ Business Performance Report Templates in Excel (Free Download)
The income statement is one of the most important financial reports, reflecting a company’s operational performance over a specific period. To ensure accuracy and a professional presentation, many businesses choose to use Excel with pre-made templates. In this article, 1Office will share how to create effective reports and compile 20+ of the latest income statement templates in Excel for you to download and apply immediately.
Mục lục
- 1. What is an income statement?
- 2. Distinguishing Between the Income Statement and the Balance Sheet
- 3. Guide to Creating an Accurate Business Performance Report
- 4. Common Mistakes When Reading and Creating Business Performance Reports and How to Fix Them
- 5. The Role of the Income Statement in Business Administration
- 6. The Meaning of Metrics in the Income Statement
- 7. How to Read a Business Performance Report
- 8. Business Performance Report Templates for Companies
- 9. Principles for Preparing and Presenting Reports
- 10. Information requirements for business performance reports
- 11. Quickly create business performance reports using software
- 12. Frequently Asked Questions
- 12. Conclusion
1. What is an income statement?
The income statement, also known as an earnings statement, is a type of financial report for a company over a specific accounting period. It is also called the profit and loss (P&L) statement or the statement of revenue and expenses. This type of report primarily focuses on a company’s revenue and expenses over a certain period.
The formula commonly used for calculations in this report is as follows:
Net Income = (Total Revenue + Gains) – (Total Expenses + Losses)
In this formula, total revenue includes all income related to the business. Total expenses include all types of costs arising from all company activities.

2. Distinguishing Between the Income Statement and the Balance Sheet
Below are the key differences that help you distinguish between the Income Statement and the Balance Sheet clearly and easily:
| Criteria | Income Statement | Balance Sheet |
| Concept | A report reflecting revenue – expenses – profit/loss over a period of time. | A report reflecting assets – liabilities – owner’s equity at a specific point in time. |
| Nature | Provides a picture of the company’s business performance. | Provides a picture of the financial situation at the closing date. |
| Reporting Period | Over a period (e.g., March or Q1). | At a specific point in time (e.g., March 31). |
| Main Content | – Revenue
– Expenses – Profit or Loss |
– Assets
– Liabilities – Owner’s Equity |
| Tax Representation | Records tax expenses incurred during the period. | Records unpaid tax liabilities. |
| Internal Purpose | To determine business efficiency and identify issues in operational or financial processes. | To assess liquidity, financial safety, and the ability to meet obligations. |
| Purpose for Investors / Lenders | To check profitability to see if the company has enough cash flow to pay debts. | To check the level of financial leverage and capital structure to decide whether to continue lending. |
| Significance | Important for investors as it directly reflects business results and company efficiency. | Important for lenders as it clearly shows the ability to pay. |
| Data for Analysis | – Profit Margin
– Gross Profit Margin – Net Income |
– Debt-to-Asset Ratio
– Liquidity – Asset and Capital Structure |
| Helps Identify What Problems? | – Losses
– Unusual Expenses – Decreased Business Efficiency |
– Increased Debt-to-Asset Ratio
– Liquidity Risk |
| Overall Role | Shows whether the business is operating effectively. | Shows what the business owns and what it owes. |
| Benefits of Use | Helps assess profitability, operational efficiency, and cost management effectiveness. | Helps assess asset value, payment capacity, and financial safety. |
3. Guide to Creating an Accurate Business Performance Report
To create an effective business performance report, businesses can follow these steps:
- Step 1 – Define the report’s purpose: Businesses need to clarify who the report is for, what decisions it will support, and what key information needs to be presented. This helps determine the appropriate layout and level of detail.
- Step 2 – Collect data: Gather all relevant data such as: Revenue, expenses, profit, and necessary financial indicators. The data source can be the accounting system, ERP software, or related departments.
- Step 3 – Process and verify data: After collection, businesses need to review, eliminate discrepancies, and calculate financial metrics. This step ensures the accuracy and reliability of the report.
- Step 4 – Present the report: The report should be presented coherently, be easy to follow, have a clear structure, and contain all necessary content. The simpler the presentation, the easier it is for the reader to understand.
- Step 6 – Analyze & draw conclusions: Finally, businesses need to analyze the data to evaluate business performance, identify strengths and weaknesses, and create a basis for developing improvement plans for the next period.
Read more:
4. Common Mistakes When Reading and Creating Business Performance Reports and How to Fix Them
Errors when creating or reading business performance reports often stem from incorrect data entry, accounting, or data review, causing revenue, expenses, and profit to deviate from reality.
| Mistakes when creating reports | Mistakes when reading reports |
|
|
Solutions
- Use accounting software to automate data entry, cross-check detailed ledgers, and accrue missing expenses before preparing reports.
- Strictly reconcile with related financial statements; regularly update new regulations according to Circular 200 and tax policies.
- Conduct quarterly internal audits to detect discrepancies early and ensure revenue and expenses are recognized in the correct period.
5. The Role of the Income Statement in Business Administration
The corporate income statement helps CEOs decide whether they can generate profit by increasing revenue, reducing costs, or both. It is also one of the reports that helps CEOs create an effective business plan. Based on an analysis of over 5,000 businesses nationwide, we have summarized the importance of the income statement as follows:

5.1. Regular Reporting
While other financial statements are published annually, the corporate income statement is generated quarterly or monthly. This allows CEOs and investors to closely monitor the company’s performance and make informed decisions. It also enables them to identify and resolve minor business issues before they become large and costly. This also serves as a basis for managers to adjust business objectives in line with the organization’s resources.
5.2. Identifying Costs
This report details future costs or any unexpected expenditures the company incurs, and any areas that are over or under budget. These costs include building rent, salaries, and other general expenses. As a small business begins to grow, it may see its costs soar. These expenses can be related to hiring employees, purchasing supplies, and promoting business activities.
5.3. Overall Analysis of Corporate Governance
Based on the income statement, banks or other organizations can review it to consider investments or loans. Therefore, the importance of this report is indispensable in helping a business progress more smoothly on its development path.
So, how should a manager read a business report within a company to grasp information effectively and quickly?
This article provides you with: How to Build Management Reports for Your Business
6. The Meaning of Metrics in the Income Statement
The following information is included in an income statement. The format of this document may vary depending on regulatory requirements, diverse business needs, and related operational activities.

6.1. Revenue or Sales
This is the first section of the income statement, and it provides you with a summary of the company’s total sales. Revenue can be divided into two types: operating and non-operating.
Operating revenue refers to the revenue a company earns by performing its primary activities, such as manufacturing a product or providing a service. Non-operating revenue is earned by performing non-core business activities such as installation, operation, or system maintenance.
6.2. Cost of Goods Sold (COGS)
Cost of goods sold is the total cost of sales or services; in other words, the cost incurred to produce goods or services. Indirect costs are not included in the cost of goods sold.
6.3. Gross Profit
Gross profit is calculated using the following formula: Net Revenue – Total Cost of Goods Sold. Net revenue is the amount you earn from the goods sold, while the cost of goods sold is the amount you spent to produce those goods.
6.4. Gains
A gain is the result of an event that increases your business’s income. It indicates the money a company receives from various business activities, such as selling an operating division.
Similarly, profits from one-time, non-business activities are also counted as gains for the business. Although gains are considered a type of secondary revenue, the two terms are different. Revenue is the money a company receives regularly, while a gain can be accounted for from the sale of a fixed asset.
6.5. Expenses
An expense is a cost that a company incurs to generate revenue and must be included in the income statement. Examples include equipment depreciation, employee salaries, and payments to suppliers. There are two main types of business expenses: operating and non-operating expenses.
Operating expenses are costs generated from the company’s primary business activities. Non-operating expenses are generated from incidental activities.
6.6. Advertising Costs
These are simply the marketing costs necessary to expand customer reach or sales markets. They include online and offline advertising.
6.7. Administrative Costs
Depreciation refers to the allocation of the original cost of a long-term asset over its useful life. This is a non-cash expense, but it is a crucial cost for a business’s survival. Depreciation primarily represents the value of the asset that the business has used up over a period of time.
6.8. Depreciation
Depreciation refers to the allocation of the original cost of a long-term asset over its useful life. It is a management arrangement to write off the value of a company’s asset, but it is considered a non-cash transaction. Depreciation primarily represents the value of the asset that the business has used up over a period of time.
6.9. Earnings Before Tax and Net Income
Earnings before tax is a measure of a company’s financial performance. It must be included in your income statement. As for net income, it is the amount you earn after deducting allowable business expenses. It is calculated by subtracting total expenses from total revenue.
| Read more: What is planning? Effective business planning methods for enterprises |
7. How to Read a Business Performance Report
To quickly and clearly understand all of a company’s business activities, you need a smart way to read the income statement. Here, we have 3 main parts to help users accurately read the overall business performance report:
First: Understand the structure and format of the business report
Each business will have different activity reports and different formats. However, they will share a common structure that you must understand clearly: Results from core operations, results from financial activities, and results from other activities.
Second: Understand the detailed meaning of the criteria in the report
This means that when you read the comprehensive business results report, you must clearly understand the content and meaning of each criterion within this report format. For example, what is gross profit, what is the cost of goods sold, and what indicators does it include…
Step 3: Compare, analyze, and evaluate the business report indicators
You must have the figures from the previous month’s, quarter’s, or year’s report to compare with the current one. This makes it easier to make assessments and sound decisions for future plans.
So, what specific criteria and formats are included when creating a business performance report?
8. Business Performance Report Templates for Companies
Refer to the common business performance report templates presented below.
Example:
Business Performance Report Template according to Circular 200

Business Performance Report Appendix Template
")
Business Performance Report Template according to Circular 133

Revenue and Expense Report Excel Template
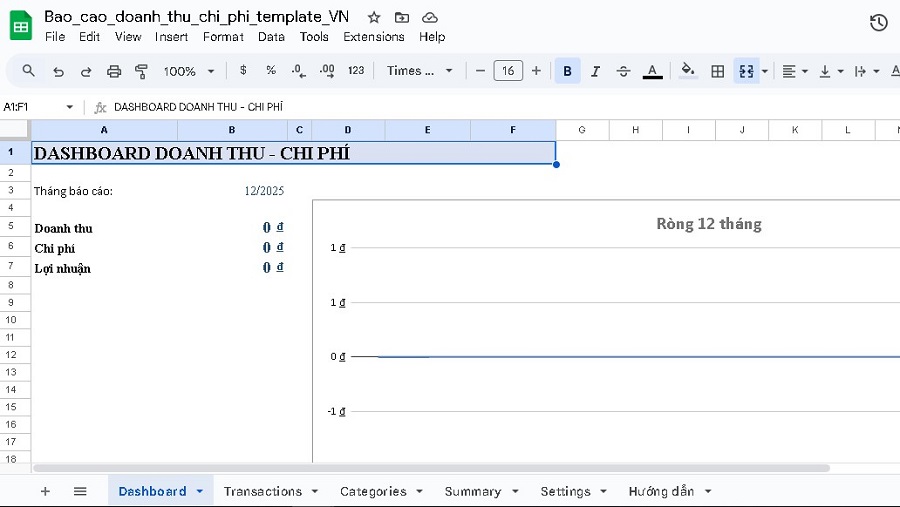
Information Fields
- Transactions: enter revenue/expense transactions (with dropdowns for Type/Category/Method), auto-calculates VAT, total amount, month
- Categories: revenue & expense categories (easy to customize)
- Summary: summarizes revenue – expenses – profit by selected month, 12-month trend + chart, expenses by category + chart
- Dashboard: Quick KPIs (Revenue/Expense/Profit) + 12-month net chart
- Settings: select report month + default VAT
- Guide: quick usage guide in the file
Download Now: Revenue and Expense Report Excel Template
Financial Statement Excel Template
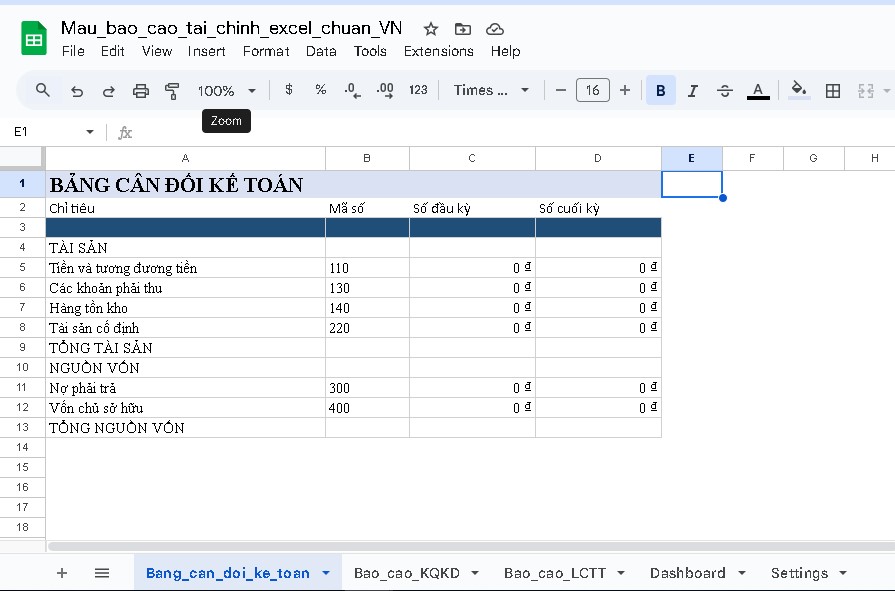
The file includes the main sheets
Balance Sheet
- Assets: Cash, Receivables, Inventory, Fixed Assets
- Liabilities and Equity: Payables, Owner’s Equity
- Includes beginning/ending period columns
- Standard VND currency format
Income Statement
- Revenue
- Cost of Goods Sold
- Gross Profit (auto-calculated)
- Selling, General & Administrative Expenses
- Net Profit (auto-calculated)
Cash Flow Statement
- Cash Flow from Operating Activities
- Cash Flow from Investing Activities
- Cash Flow from Financing Activities
- Net Cash Flow (auto-summed)
Financial Dashboard
- Revenue
- Profit
- Total Assets
→ Data is pulled automatically from reports
Settings
- Select reporting period
- Currency unit
Download Now: Financial report excel template
Internal financial report excel template
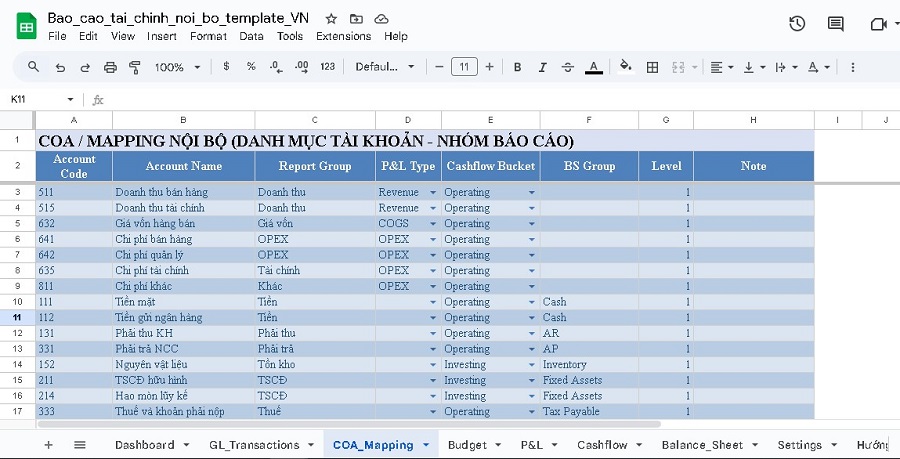
The file includes the following main sheets
- Settings: select Year + Closing Month
- COA_Mapping: chart of accounts & report groups (P&L Type, Cashflow Bucket, BS Group)
- GL_Transactions: journal entries (Debit/Credit) → auto-lookup group by COA
- Budget (optional): enter monthly budget to compare Actual vs Budget
- P&L: revenue/COGS/OPEX → gross & net profit, MTD/YTD, 12-month trend + chart
- Cashflow: Operating / Investing / Financing (MTD) + Net Cashflow
- Dashboard: Quick KPIs + trend charts
- Instructions: quick guide within the file
Download Now: Internal financial report excel template
The templates above are business performance reports presented in a conventional way. Therefore, they can have many disadvantages in terms of calculation methods and are not scientific or modern to view. You will spend a lot of time getting the most comprehensive overview, waste human resources on this report, and sometimes it is inaccurate and requires many revisions and additions.
That is why modern smart business reporting systems have been developed to help CEOs and C-level executives create business performance reports quickly and scientifically.
9. Principles for Preparing and Presenting Reports
Preparing and presenting a business performance report is not just about recording figures but also a process of faithfully and accurately reflecting the company’s business situation. To ensure the report is objective and reliable, businesses need to adhere to several important principles, such as:

- Compliance with accounting standards: The business performance report must be prepared in accordance with the regulations in national accounting standards, specifically “presentation of financial statements” and other related standards.
- Full and fair representation: All information related to the company’s business activities must be presented and provided truthfully, clearly, and completely. Material information that could influence the decisions of report users must be ensured to be accurate and transparent.
- Prudence and accuracy: During the report preparation process, you need to be cautious in identifying and recording figures. The report must be based on reliable evidence and thoroughly checked to minimize discrepancies.
- Do not recognize internal transactions: For member units within a company, revenues, expenses, profits, and losses arising from internal transactions are not to be recognized in the business performance report. This is to avoid duplication and ensure the integrity of the financial statements.
10. Information requirements for business performance reports
To ensure the quality, transparency, and policy of the information in the report, you need to note the following points:
- True and fair: The information in the report must accurately reflect the nature of the business’s economic and financial operations. The report preparer is not allowed to exaggerate or distort information, ensuring the most authentic view for the report user.
- Complete: The report must provide all necessary information related to revenue, expenses, profits, and risk factors that may affect business operations so that the reader can easily grasp the company’s current situation.
- Objective: Objectivity in presenting information is a key factor to ensure that the reader is not influenced by misleading information. All data in the report must be presented transparently, without bias in any case.
- Verifiable: All information in the report must have a clear basis for verification. The data used in the report must be based on reliable documents, books, and accounting evidence to ensure the accuracy and reliability of the report.
- Timely and understandable: The business performance report must be prepared and submitted in accordance with the deadlines prescribed by law and the company. This helps relevant parties grasp the situation promptly and quickly. In addition, the report needs to be presented in a clear, scientific structure with easy-to-understand language so that the reader can easily grasp the content.
In addition to the above requirements, the report preparer also needs to ensure consistency and comparability between accounting periods or between businesses, helping users easily evaluate and analyze business results effectively.
11. Quickly create business performance reports using software
There are many report templates available on the market today. However, if you want to shorten your daily work time and reduce the hassles of analyzing and evaluating the company’s business reports, you can consider the 1Office business management software.
1Office is a comprehensive enterprise management solution, one of the work management software that helps all personnel in the enterprise (leaders, mid-level managers, team leaders, department heads, and sales staff) connect within a single ecosystem. This solution integrates all management tools, from managing work and people to specific business activities such as: HRM – CRM – Workplace.

Among them, the CRM software is a module for managing business operations from A to Z, such as:
- All marketing activities
- All customer care activities
- Other business activities
- Complete information about the company’s cash flow: revenue and expenditure for each specific activity.
- Manage and monitor all information and metrics about products and inventory.
- Automatic and intelligent reporting with a scientific Dashboard.
Specifically, the business performance report on 1Office’s Dashboard feature allows you to:
- Set up pre-built formulas for all types of business performance reports.
- Summarize and analyze data updated daily and hourly.
- Automatically compile and generate final reports periodically, such as monthly, quarterly, or yearly.
- Store data permanently on the software, making it easy for you to compare with other data.
12. Frequently Asked Questions
11.1. Where does the data for preparing a business performance report come from?
The business performance report is prepared based on the company’s accounting books. Specifically, data from accounts type 5 to type 8 will be used to reflect the company’s business performance results.
11.2. What should be noted when reading a business performance report?
When reading and analyzing a business performance report, users should pay attention to the following 3 factors:
- Report structure: The reader needs to clearly understand the report’s structure to grasp and access the information correctly. Typically, a business performance report will include 3 main sections: Results from business operations, results from financial activities, and results from other activities.
- Meaning of the metrics: Correctly and fully understanding the meaning of the financial metrics on the report is a crucial factor for the reader to make accurate assessments of the business situation.
- Analysis and comparison: Comparing results and metrics with the same period or with other companies in the same industry will help you make more accurate assessments and predictions about future business trends.
11.3. How to analyze a business performance report effectively?
To analyze a business performance report effectively, you can refer to and follow these steps:
- Group revenue and expenses: Dividing revenue and expense items into smaller groups will help the business easily track and analyze fluctuations. For example: revenue can be divided into revenue from sales, service provision, and financial revenue; expenses can be divided into production costs, selling expenses, and general & administrative expenses.
- Calculate proportions: After completing the grouping, the report preparer needs to calculate the proportion of each revenue and expense item to the total. This proportion will help you assess the impact of each item on the overall business results.
- Compare with the same period: Comparing financial metrics with the same period in previous years will help you evaluate the company’s growth or decline, thereby identifying significant changes in the company’s business operations.
12. Conclusion
Business performance reports provide valuable, detailed information about various aspects of a business. They cover the company’s operations, the efficiency of those activities, potential risks that could erode profits, and whether the company is on the right track. Therefore, choosing a convenient solution to save time and operational costs is the top priority right now.
For more detailed information, please contact us via:
Hotline: 083 483 8888
1Office Fanpage: https://www.facebook.com/1officevn
Youtube: https://www.youtube.com/c/1OfficeNềntảngquảnlýtổngthểDoanhNghiệp